Immigrants from Eastern Asia vs Tongan College, 1 year or more

COMPARE

Immigrants from Eastern Asia
Race
Ancestry
AfghanAfricanAlaska NativeAlaskan AthabascanAlbanianAleutAlsatianAmericanApacheArabArapahoArgentineanArmenianAssyrian/Chaldean/SyriacAustralianAustrianBahamianBangladeshiBarbadianBasqueBelgianBelizeanBermudanBhutaneseBlackfeetBolivianBrazilianBritishBritish West IndianBulgarianBurmeseCajunCambodianCanadianCape VerdeanCarpatho RusynCelticCentral AmericanCentral American IndianCherokeeCheyenneChickasawChileanChineseChippewaChoctawColombianColvilleComancheCosta RicanCreeCreekCroatianCrowCubanCypriotCzechCzechoslovakianDanishDelawareDominicanDutchDutch West IndianEastern EuropeanEcuadorianEgyptianEnglishEstonianEthiopianEuropeanFijianFilipinoFinnishFrenchFrench American IndianFrench CanadianGermanGerman RussianGhanaianGreekGuamanian/ChamorroGuatemalanGuyaneseHaitianHmongHonduranHopiHoumaHungarianIcelanderIndian (Asian)IndonesianInupiatIranianIraqiIrishIroquoisIsraeliItalianJamaicanJapaneseJordanianKenyanKiowaKoreanLaotianLatvianLebaneseLiberianLithuanianLumbeeLuxembourgerMacedonianMalaysianMalteseMarshalleseMenomineeMexicanMexican American IndianMongolianMoroccanNative HawaiianNavajoNepaleseNew ZealanderNicaraguanNigerianNorthern EuropeanNorwegianOkinawanOsageOttawaPaiutePakistaniPalestinianPanamanianParaguayanPennsylvania GermanPeruvianPimaPolishPortuguesePotawatomiPuebloPuerto RicanPuget Sound SalishRomanianRussianSalvadoranSamoanScandinavianScotch-IrishScottishSeminoleSenegaleseSerbianShoshoneSierra LeoneanSiouxSlavicSlovakSloveneSomaliSouth AfricanSouth AmericanSouth American IndianSoviet UnionSpaniardSpanishSpanish AmericanSpanish American IndianSri LankanSubsaharan AfricanSudaneseSwedishSwissSyrianTaiwaneseThaiTlingit-HaidaTohono O'OdhamTrinidadian and TobagonianTsimshianTurkishU.S. Virgin IslanderUgandanUkrainianUruguayanUteVenezuelanVietnameseWelshWest IndianYakamaYaquiYugoslavianYumanYup'ikZimbabwean
Immigration
NonimmigrantsImmigrantsAfghanistanAfricaAlbaniaArgentinaArmeniaAsiaAustraliaAustriaBahamasBangladeshBarbadosBelarusBelgiumBelizeBoliviaBosnia and HerzegovinaBrazilBulgariaBurma/MyanmarCabo VerdeCambodiaCameroonCanadaCaribbeanCentral AmericaChileChinaColombiaCongoCosta RicaCroatiaCubaCzechoslovakiaDenmarkDominicaDominican RepublicEastern AfricaEastern AsiaEastern EuropeEcuadorEgyptEl SalvadorEnglandEritreaEthiopiaEuropeFijiFranceGermanyGhanaGreeceGrenadaGuatemalaGuyanaHaitiHondurasHong KongHungaryIndiaIndonesiaIranIraqIrelandIsraelItalyJamaicaJapanJordanKazakhstanKenyaKoreaKuwaitLaosLatin AmericaLatviaLebanonLiberiaLithuaniaMalaysiaMexicoMicronesiaMiddle AfricaMoldovaMoroccoNepalNetherlandsNicaraguaNigeriaNorth AmericaNorth MacedoniaNorthern AfricaNorthern EuropeNorwayOceaniaPakistanPanamaPeruPhilippinesPolandPortugalRomaniaRussiaSaudi ArabiaScotlandSenegalSerbiaSierra LeoneSingaporeSomaliaSouth AfricaSouth AmericaSouth Central AsiaSouth Eastern AsiaSouthern EuropeSpainSri LankaSt. Vincent and the GrenadinesSudanSwedenSwitzerlandSyriaTaiwanThailandTrinidad and TobagoTurkeyUgandaUkraineUruguayUzbekistanVenezuelaVietnamWest IndiesWestern AfricaWestern AsiaWestern EuropeYemenZaireZimbabweAzores
Tongan
Race
Ancestry
AfghanAfricanAlaska NativeAlaskan AthabascanAlbanianAleutAlsatianAmericanApacheArabArapahoArgentineanArmenianAssyrian/Chaldean/SyriacAustralianAustrianBahamianBangladeshiBarbadianBasqueBelgianBelizeanBermudanBhutaneseBlackfeetBolivianBrazilianBritishBritish West IndianBulgarianBurmeseCajunCambodianCanadianCape VerdeanCarpatho RusynCelticCentral AmericanCentral American IndianCherokeeCheyenneChickasawChileanChineseChippewaChoctawColombianColvilleComancheCosta RicanCreeCreekCroatianCrowCubanCypriotCzechCzechoslovakianDanishDelawareDominicanDutchDutch West IndianEastern EuropeanEcuadorianEgyptianEnglishEstonianEthiopianEuropeanFijianFilipinoFinnishFrenchFrench American IndianFrench CanadianGermanGerman RussianGhanaianGreekGuamanian/ChamorroGuatemalanGuyaneseHaitianHmongHonduranHopiHoumaHungarianIcelanderIndian (Asian)IndonesianInupiatIranianIraqiIrishIroquoisIsraeliItalianJamaicanJapaneseJordanianKenyanKiowaKoreanLaotianLatvianLebaneseLiberianLithuanianLumbeeLuxembourgerMacedonianMalaysianMalteseMarshalleseMenomineeMexicanMexican American IndianMongolianMoroccanNative HawaiianNavajoNepaleseNew ZealanderNicaraguanNigerianNorthern EuropeanNorwegianOkinawanOsageOttawaPaiutePakistaniPalestinianPanamanianParaguayanPennsylvania GermanPeruvianPimaPolishPortuguesePotawatomiPuebloPuerto RicanPuget Sound SalishRomanianRussianSalvadoranSamoanScandinavianScotch-IrishScottishSeminoleSenegaleseSerbianShoshoneSierra LeoneanSiouxSlavicSlovakSloveneSomaliSouth AfricanSouth AmericanSouth American IndianSoviet UnionSpaniardSpanishSpanish AmericanSpanish American IndianSri LankanSubsaharan AfricanSudaneseSwedishSwissSyrianTaiwaneseThaiTlingit-HaidaTohono O'OdhamTonganTrinidadian and TobagonianTsimshianTurkishU.S. Virgin IslanderUgandanUkrainianUruguayanUteVenezuelanVietnameseWelshWest IndianYakamaYaquiYugoslavianYumanYup'ikZimbabwean
Immigration
NonimmigrantsImmigrantsAfghanistanAfricaAlbaniaArgentinaArmeniaAsiaAustraliaAustriaBahamasBangladeshBarbadosBelarusBelgiumBelizeBoliviaBosnia and HerzegovinaBrazilBulgariaBurma/MyanmarCabo VerdeCambodiaCameroonCanadaCaribbeanCentral AmericaChileChinaColombiaCongoCosta RicaCroatiaCubaCzechoslovakiaDenmarkDominicaDominican RepublicEastern AfricaEastern EuropeEcuadorEgyptEl SalvadorEnglandEritreaEthiopiaEuropeFijiFranceGermanyGhanaGreeceGrenadaGuatemalaGuyanaHaitiHondurasHong KongHungaryIndiaIndonesiaIranIraqIrelandIsraelItalyJamaicaJapanJordanKazakhstanKenyaKoreaKuwaitLaosLatin AmericaLatviaLebanonLiberiaLithuaniaMalaysiaMexicoMicronesiaMiddle AfricaMoldovaMoroccoNepalNetherlandsNicaraguaNigeriaNorth AmericaNorth MacedoniaNorthern AfricaNorthern EuropeNorwayOceaniaPakistanPanamaPeruPhilippinesPolandPortugalRomaniaRussiaSaudi ArabiaScotlandSenegalSerbiaSierra LeoneSingaporeSomaliaSouth AfricaSouth AmericaSouth Central AsiaSouth Eastern AsiaSouthern EuropeSpainSri LankaSt. Vincent and the GrenadinesSudanSwedenSwitzerlandSyriaTaiwanThailandTrinidad and TobagoTurkeyUgandaUkraineUruguayUzbekistanVenezuelaVietnamWest IndiesWestern AfricaWestern AsiaWestern EuropeYemenZaireZimbabweAzores
College, 1 year or more
Income
Poverty
Unemployment
Labor Participation
Family Structure
Vehicle Availability
Education Level
Disability

College, 1 year or more Comparison

Immigrants from Eastern Asia

Tongans

Exceptional
Poor
66.6%
COLLEGE, 1 YEAR OR MORE
100.0/ 100
METRIC RATING
17th/ 347
METRIC RANK
57.8%
COLLEGE, 1 YEAR OR MORE
11.6/ 100
METRIC RATING
215th/ 347
METRIC RANK

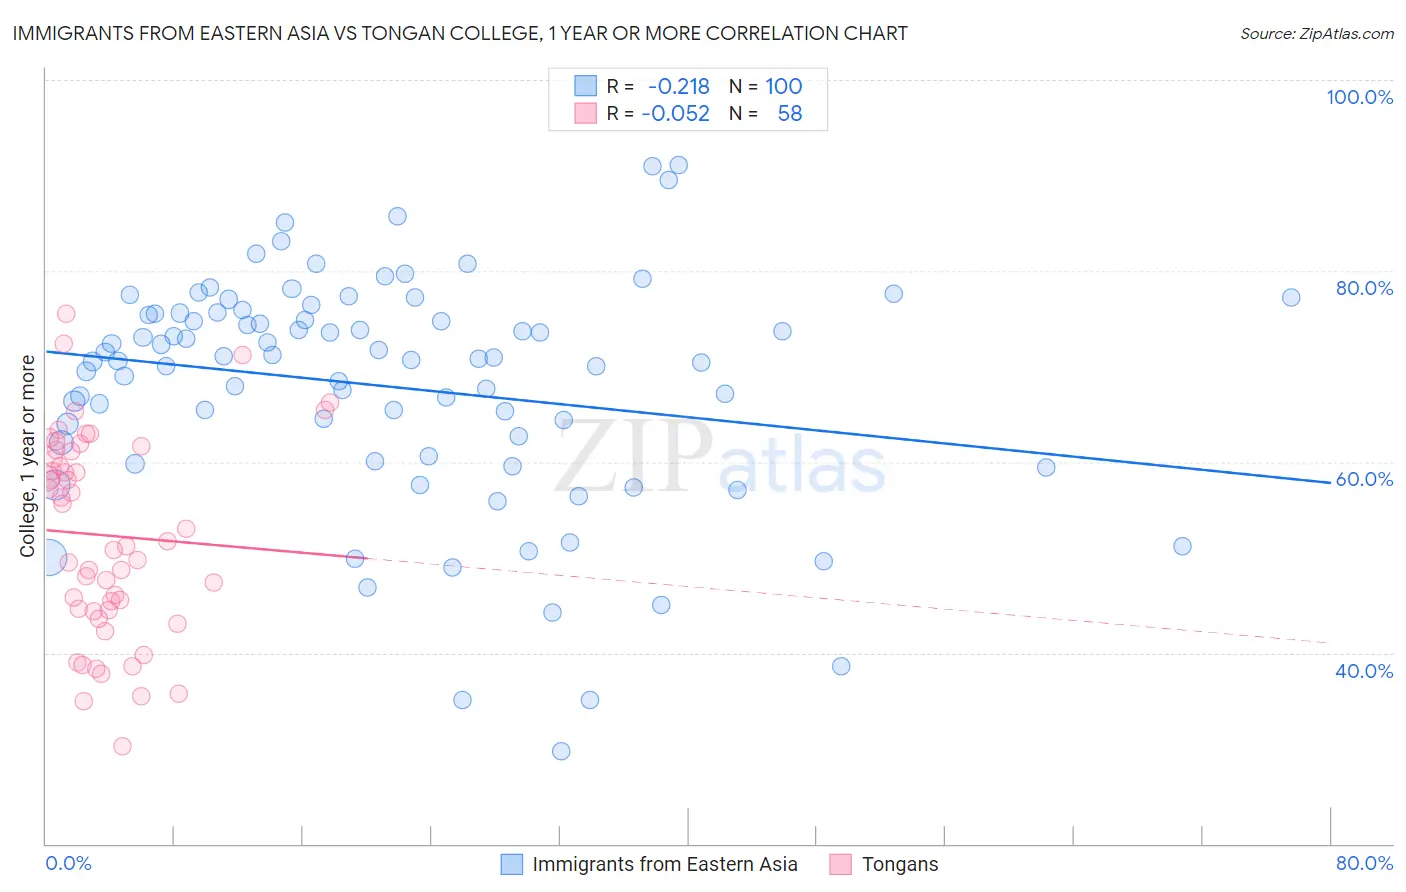
Immigrants from Eastern Asia vs Tongan College, 1 year or more Correlation Chart

The statistical analysis conducted on geographies consisting of 499,934,698 people shows a weak negative correlation between the proportion of Immigrants from Eastern Asia and percentage of population with at least college, 1 year or more education in the United States with a correlation coefficient (R) of -0.218 and weighted average of 66.6%. Similarly, the statistical analysis conducted on geographies consisting of 102,908,759 people shows a slight negative correlation between the proportion of Tongans and percentage of population with at least college, 1 year or more education in the United States with a correlation coefficient (R) of -0.052 and weighted average of 57.8%, a difference of 15.2%.
Immigrants from Eastern Asia vs Tongan College, 1 year or more

College, 1 year or more Correlation Summary

MeasurementImmigrants from Eastern AsiaTongan
Minimum29.7%30.2%
Maximum91.1%75.6%
Range61.4%45.4%
Mean67.8%52.3%
Median70.7%51.4%
Interquartile 25% (IQ1)61.3%44.5%
Interquartile 75% (IQ3)75.6%61.1%
Interquartile Range (IQR)14.2%16.6%
Standard Deviation (Sample)12.1%10.5%
Standard Deviation (Population)12.1%10.5%

Similar Demographics by College, 1 year or more

Demographics Similar to Immigrants from Eastern Asia by College, 1 year or more

In terms of college, 1 year or more, the demographic groups most similar to Immigrants from Eastern Asia are Eastern European (66.6%, a difference of 0.070%), Immigrants from Japan (66.7%, a difference of 0.11%), Immigrants from Switzerland (66.5%, a difference of 0.12%), Burmese (66.7%, a difference of 0.15%), and Cambodian (66.7%, a difference of 0.15%).
DemographicsRating | RankCollege, 1 year or more
Immigrants | Australia
100.0
/100
|
#10
Exceptional
67.7%
Immigrants | South Central Asia
100.0
/100
|
#11
Exceptional
67.1%
Cypriots
100.0
/100
|
#12
Exceptional
67.0%
Immigrants | Sweden
100.0
/100
|
#13
Exceptional
66.8%
Burmese
100.0
/100
|
#14
Exceptional
66.7%
Cambodians
100.0
/100
|
#15
Exceptional
66.7%
Immigrants | Japan
100.0
/100
|
#16
Exceptional
66.7%
Immigrants | Eastern Asia
100.0
/100
|
#17
Exceptional
66.6%
Eastern Europeans
100.0
/100
|
#18
Exceptional
66.6%
Immigrants | Switzerland
100.0
/100
|
#19
Exceptional
66.5%
Immigrants | Korea
100.0
/100
|
#20
Exceptional
66.5%
Immigrants | Hong Kong
100.0
/100
|
#21
Exceptional
66.4%
Soviet Union
100.0
/100
|
#22
Exceptional
66.4%
Immigrants | China
100.0
/100
|
#23
Exceptional
66.4%
Immigrants | Belgium
100.0
/100
|
#24
Exceptional
66.3%

Demographics Similar to Tongans by College, 1 year or more

In terms of college, 1 year or more, the demographic groups most similar to Tongans are Immigrants from Colombia (57.8%, a difference of 0.0%), Immigrants from Senegal (57.8%, a difference of 0.040%), French Canadian (57.8%, a difference of 0.040%), Immigrants from Peru (57.7%, a difference of 0.13%), and Immigrants from Nigeria (57.9%, a difference of 0.21%).
DemographicsRating | RankCollege, 1 year or more
Immigrants | Uruguay
15.2
/100
|
#208
Poor
58.1%
Immigrants | Middle Africa
14.0
/100
|
#209
Poor
58.0%
Tsimshian
13.5
/100
|
#210
Poor
57.9%
Immigrants | Nigeria
13.3
/100
|
#211
Poor
57.9%
Immigrants | Senegal
11.8
/100
|
#212
Poor
57.8%
French Canadians
11.8
/100
|
#213
Poor
57.8%
Immigrants | Colombia
11.6
/100
|
#214
Poor
57.8%
Tongans
11.6
/100
|
#215
Poor
57.8%
Immigrants | Peru
10.6
/100
|
#216
Poor
57.7%
Immigrants | Panama
9.1
/100
|
#217
Tragic
57.6%
Native Hawaiians
9.0
/100
|
#218
Tragic
57.6%
Whites/Caucasians
8.7
/100
|
#219
Tragic
57.6%
Immigrants | Costa Rica
8.0
/100
|
#220
Tragic
57.5%
Immigrants | Ghana
7.7
/100
|
#221
Tragic
57.4%
Sub-Saharan Africans
6.1
/100
|
#222
Tragic
57.3%