Immigrants from Colombia vs Japanese College, 1 year or more

COMPARE

Immigrants from Colombia
Race
Ancestry
AfghanAfricanAlaska NativeAlaskan AthabascanAlbanianAleutAlsatianAmericanApacheArabArapahoArgentineanArmenianAssyrian/Chaldean/SyriacAustralianAustrianBahamianBangladeshiBarbadianBasqueBelgianBelizeanBermudanBhutaneseBlackfeetBolivianBrazilianBritishBritish West IndianBulgarianBurmeseCajunCambodianCanadianCape VerdeanCarpatho RusynCelticCentral AmericanCentral American IndianCherokeeCheyenneChickasawChileanChineseChippewaChoctawColombianColvilleComancheCosta RicanCreeCreekCroatianCrowCubanCypriotCzechCzechoslovakianDanishDelawareDominicanDutchDutch West IndianEastern EuropeanEcuadorianEgyptianEnglishEstonianEthiopianEuropeanFijianFilipinoFinnishFrenchFrench American IndianFrench CanadianGermanGerman RussianGhanaianGreekGuamanian/ChamorroGuatemalanGuyaneseHaitianHmongHonduranHopiHoumaHungarianIcelanderIndian (Asian)IndonesianInupiatIranianIraqiIrishIroquoisIsraeliItalianJamaicanJordanianKenyanKiowaKoreanLaotianLatvianLebaneseLiberianLithuanianLumbeeLuxembourgerMacedonianMalaysianMalteseMarshalleseMenomineeMexicanMexican American IndianMongolianMoroccanNative HawaiianNavajoNepaleseNew ZealanderNicaraguanNigerianNorthern EuropeanNorwegianOkinawanOsageOttawaPaiutePakistaniPalestinianPanamanianParaguayanPennsylvania GermanPeruvianPimaPolishPortuguesePotawatomiPuebloPuerto RicanPuget Sound SalishRomanianRussianSalvadoranSamoanScandinavianScotch-IrishScottishSeminoleSenegaleseSerbianShoshoneSierra LeoneanSiouxSlavicSlovakSloveneSomaliSouth AfricanSouth AmericanSouth American IndianSoviet UnionSpaniardSpanishSpanish AmericanSpanish American IndianSri LankanSubsaharan AfricanSudaneseSwedishSwissSyrianTaiwaneseThaiTlingit-HaidaTohono O'OdhamTonganTrinidadian and TobagonianTsimshianTurkishU.S. Virgin IslanderUgandanUkrainianUruguayanUteVenezuelanVietnameseWelshWest IndianYakamaYaquiYugoslavianYumanYup'ikZimbabwean
Immigration
NonimmigrantsImmigrantsAfghanistanAfricaAlbaniaArgentinaArmeniaAsiaAustraliaAustriaBahamasBangladeshBarbadosBelarusBelgiumBelizeBoliviaBosnia and HerzegovinaBrazilBulgariaBurma/MyanmarCabo VerdeCambodiaCameroonCanadaCaribbeanCentral AmericaChileChinaColombiaCongoCosta RicaCroatiaCubaCzechoslovakiaDenmarkDominicaDominican RepublicEastern AfricaEastern AsiaEastern EuropeEcuadorEgyptEl SalvadorEnglandEritreaEthiopiaEuropeFijiFranceGermanyGhanaGreeceGrenadaGuatemalaGuyanaHaitiHondurasHong KongHungaryIndiaIndonesiaIranIraqIrelandIsraelItalyJamaicaJapanJordanKazakhstanKenyaKoreaKuwaitLaosLatin AmericaLatviaLebanonLiberiaLithuaniaMalaysiaMexicoMicronesiaMiddle AfricaMoldovaMoroccoNepalNetherlandsNicaraguaNigeriaNorth AmericaNorth MacedoniaNorthern AfricaNorthern EuropeNorwayOceaniaPakistanPanamaPeruPhilippinesPolandPortugalRomaniaRussiaSaudi ArabiaScotlandSenegalSerbiaSierra LeoneSingaporeSomaliaSouth AfricaSouth AmericaSouth Central AsiaSouth Eastern AsiaSouthern EuropeSpainSri LankaSt. Vincent and the GrenadinesSudanSwedenSwitzerlandSyriaTaiwanThailandTrinidad and TobagoTurkeyUgandaUkraineUruguayUzbekistanVenezuelaVietnamWest IndiesWestern AfricaWestern AsiaWestern EuropeYemenZaireZimbabweAzores
Japanese
Race
Ancestry
AfghanAfricanAlaska NativeAlaskan AthabascanAlbanianAleutAlsatianAmericanApacheArabArapahoArgentineanArmenianAssyrian/Chaldean/SyriacAustralianAustrianBahamianBangladeshiBarbadianBasqueBelgianBelizeanBermudanBhutaneseBlackfeetBolivianBrazilianBritishBritish West IndianBulgarianBurmeseCajunCambodianCanadianCape VerdeanCarpatho RusynCelticCentral AmericanCentral American IndianCherokeeCheyenneChickasawChileanChineseChippewaChoctawColombianColvilleComancheCosta RicanCreeCreekCroatianCrowCubanCypriotCzechCzechoslovakianDanishDelawareDominicanDutchDutch West IndianEastern EuropeanEcuadorianEgyptianEnglishEstonianEthiopianEuropeanFijianFilipinoFinnishFrenchFrench American IndianFrench CanadianGermanGerman RussianGhanaianGreekGuamanian/ChamorroGuatemalanGuyaneseHaitianHmongHonduranHopiHoumaHungarianIcelanderIndian (Asian)IndonesianInupiatIranianIraqiIrishIroquoisIsraeliItalianJamaicanJapaneseJordanianKenyanKiowaKoreanLaotianLatvianLebaneseLiberianLithuanianLumbeeLuxembourgerMacedonianMalaysianMalteseMarshalleseMenomineeMexicanMexican American IndianMongolianMoroccanNative HawaiianNavajoNepaleseNew ZealanderNicaraguanNigerianNorthern EuropeanNorwegianOkinawanOsageOttawaPaiutePakistaniPalestinianPanamanianParaguayanPennsylvania GermanPeruvianPimaPolishPortuguesePotawatomiPuebloPuerto RicanPuget Sound SalishRomanianRussianSalvadoranSamoanScandinavianScotch-IrishScottishSeminoleSenegaleseSerbianShoshoneSierra LeoneanSiouxSlavicSlovakSloveneSomaliSouth AfricanSouth AmericanSouth American IndianSoviet UnionSpaniardSpanishSpanish AmericanSpanish American IndianSri LankanSubsaharan AfricanSudaneseSwedishSwissSyrianTaiwaneseThaiTlingit-HaidaTohono O'OdhamTonganTrinidadian and TobagonianTsimshianTurkishU.S. Virgin IslanderUgandanUkrainianUruguayanUteVenezuelanVietnameseWelshWest IndianYakamaYaquiYugoslavianYumanYup'ikZimbabwean
Immigration
NonimmigrantsImmigrantsAfghanistanAfricaAlbaniaArgentinaArmeniaAsiaAustraliaAustriaBahamasBangladeshBarbadosBelarusBelgiumBelizeBoliviaBosnia and HerzegovinaBrazilBulgariaBurma/MyanmarCabo VerdeCambodiaCameroonCanadaCaribbeanCentral AmericaChileChinaCongoCosta RicaCroatiaCubaCzechoslovakiaDenmarkDominicaDominican RepublicEastern AfricaEastern AsiaEastern EuropeEcuadorEgyptEl SalvadorEnglandEritreaEthiopiaEuropeFijiFranceGermanyGhanaGreeceGrenadaGuatemalaGuyanaHaitiHondurasHong KongHungaryIndiaIndonesiaIranIraqIrelandIsraelItalyJamaicaJapanJordanKazakhstanKenyaKoreaKuwaitLaosLatin AmericaLatviaLebanonLiberiaLithuaniaMalaysiaMexicoMicronesiaMiddle AfricaMoldovaMoroccoNepalNetherlandsNicaraguaNigeriaNorth AmericaNorth MacedoniaNorthern AfricaNorthern EuropeNorwayOceaniaPakistanPanamaPeruPhilippinesPolandPortugalRomaniaRussiaSaudi ArabiaScotlandSenegalSerbiaSierra LeoneSingaporeSomaliaSouth AfricaSouth AmericaSouth Central AsiaSouth Eastern AsiaSouthern EuropeSpainSri LankaSt. Vincent and the GrenadinesSudanSwedenSwitzerlandSyriaTaiwanThailandTrinidad and TobagoTurkeyUgandaUkraineUruguayUzbekistanVenezuelaVietnamWest IndiesWestern AfricaWestern AsiaWestern EuropeYemenZaireZimbabweAzores
College, 1 year or more
Income
Poverty
Unemployment
Labor Participation
Family Structure
Vehicle Availability
Education Level
Disability

College, 1 year or more Comparison

Immigrants from Colombia

Japanese

Poor
Tragic
57.8%
COLLEGE, 1 YEAR OR MORE
11.6/ 100
METRIC RATING
214th/ 347
METRIC RANK
55.2%
COLLEGE, 1 YEAR OR MORE
0.5/ 100
METRIC RATING
254th/ 347
METRIC RANK

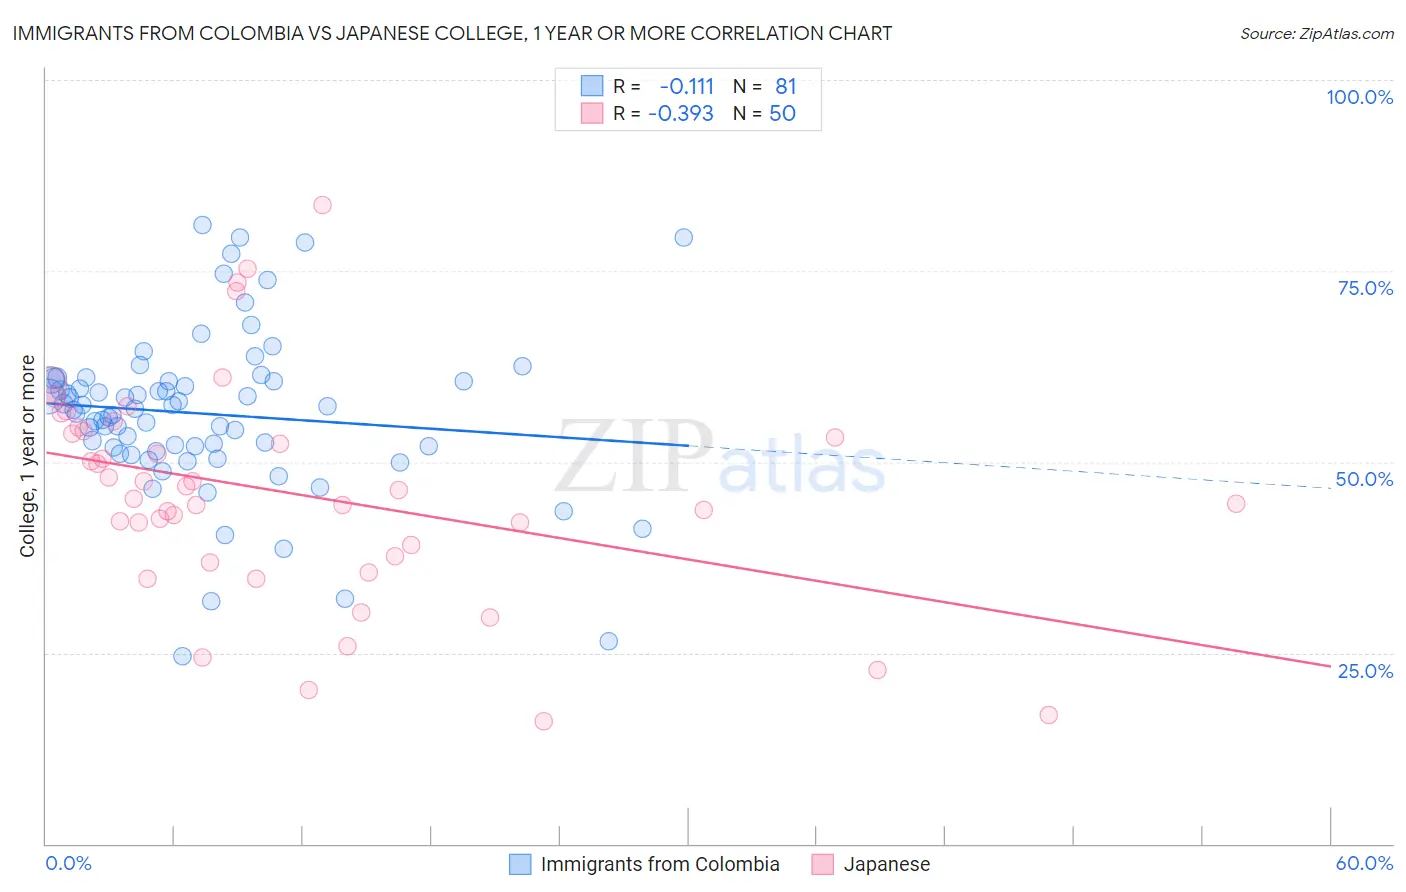
Immigrants from Colombia vs Japanese College, 1 year or more Correlation Chart

The statistical analysis conducted on geographies consisting of 378,687,641 people shows a poor negative correlation between the proportion of Immigrants from Colombia and percentage of population with at least college, 1 year or more education in the United States with a correlation coefficient (R) of -0.111 and weighted average of 57.8%. Similarly, the statistical analysis conducted on geographies consisting of 249,181,552 people shows a mild negative correlation between the proportion of Japanese and percentage of population with at least college, 1 year or more education in the United States with a correlation coefficient (R) of -0.393 and weighted average of 55.2%, a difference of 4.7%.
Immigrants from Colombia vs Japanese College, 1 year or more

College, 1 year or more Correlation Summary

MeasurementImmigrants from ColombiaJapanese
Minimum24.6%16.1%
Maximum81.0%83.7%
Range56.4%67.6%
Mean56.3%45.9%
Median57.0%45.8%
Interquartile 25% (IQ1)51.7%37.6%
Interquartile 75% (IQ3)60.7%54.1%
Interquartile Range (IQR)9.0%16.5%
Standard Deviation (Sample)10.7%14.4%
Standard Deviation (Population)10.6%14.2%

Similar Demographics by College, 1 year or more

Demographics Similar to Immigrants from Colombia by College, 1 year or more

In terms of college, 1 year or more, the demographic groups most similar to Immigrants from Colombia are Tongan (57.8%, a difference of 0.0%), Immigrants from Senegal (57.8%, a difference of 0.030%), French Canadian (57.8%, a difference of 0.030%), Immigrants from Peru (57.7%, a difference of 0.14%), and Immigrants from Nigeria (57.9%, a difference of 0.21%).
DemographicsRating | RankCollege, 1 year or more
Senegalese
16.9
/100
|
#207
Poor
58.2%
Immigrants | Uruguay
15.2
/100
|
#208
Poor
58.1%
Immigrants | Middle Africa
14.0
/100
|
#209
Poor
58.0%
Tsimshian
13.5
/100
|
#210
Poor
57.9%
Immigrants | Nigeria
13.3
/100
|
#211
Poor
57.9%
Immigrants | Senegal
11.8
/100
|
#212
Poor
57.8%
French Canadians
11.8
/100
|
#213
Poor
57.8%
Immigrants | Colombia
11.6
/100
|
#214
Poor
57.8%
Tongans
11.6
/100
|
#215
Poor
57.8%
Immigrants | Peru
10.6
/100
|
#216
Poor
57.7%
Immigrants | Panama
9.1
/100
|
#217
Tragic
57.6%
Native Hawaiians
9.0
/100
|
#218
Tragic
57.6%
Whites/Caucasians
8.7
/100
|
#219
Tragic
57.6%
Immigrants | Costa Rica
8.0
/100
|
#220
Tragic
57.5%
Immigrants | Ghana
7.7
/100
|
#221
Tragic
57.4%

Demographics Similar to Japanese by College, 1 year or more

In terms of college, 1 year or more, the demographic groups most similar to Japanese are Immigrants from Bahamas (55.2%, a difference of 0.050%), Immigrants from West Indies (55.2%, a difference of 0.12%), Indonesian (55.1%, a difference of 0.22%), Immigrants from Barbados (55.4%, a difference of 0.25%), and Aleut (55.4%, a difference of 0.36%).
DemographicsRating | RankCollege, 1 year or more
Hawaiians
0.8
/100
|
#247
Tragic
55.6%
Immigrants | Congo
0.8
/100
|
#248
Tragic
55.6%
Immigrants | Trinidad and Tobago
0.7
/100
|
#249
Tragic
55.5%
Delaware
0.7
/100
|
#250
Tragic
55.5%
Immigrants | Cambodia
0.6
/100
|
#251
Tragic
55.4%
Aleuts
0.6
/100
|
#252
Tragic
55.4%
Immigrants | Barbados
0.6
/100
|
#253
Tragic
55.4%
Japanese
0.5
/100
|
#254
Tragic
55.2%
Immigrants | Bahamas
0.5
/100
|
#255
Tragic
55.2%
Immigrants | West Indies
0.5
/100
|
#256
Tragic
55.2%
Indonesians
0.4
/100
|
#257
Tragic
55.1%
Africans
0.4
/100
|
#258
Tragic
55.0%
Nepalese
0.3
/100
|
#259
Tragic
54.9%
Jamaicans
0.3
/100
|
#260
Tragic
54.9%
Ottawa
0.3
/100
|
#261
Tragic
54.9%