Immigrants from Cameroon vs Scotch-Irish No Schooling Completed
COMPARE
Immigrants from Cameroon
Scotch-Irish
No Schooling Completed
No Schooling Completed Comparison
Immigrants from Cameroon
Scotch-Irish
2.5%
NO SCHOOLING COMPLETED
0.1/ 100
METRIC RATING
273rd/ 347
METRIC RANK
1.5%
NO SCHOOLING COMPLETED
100.0/ 100
METRIC RATING
14th/ 347
METRIC RANK
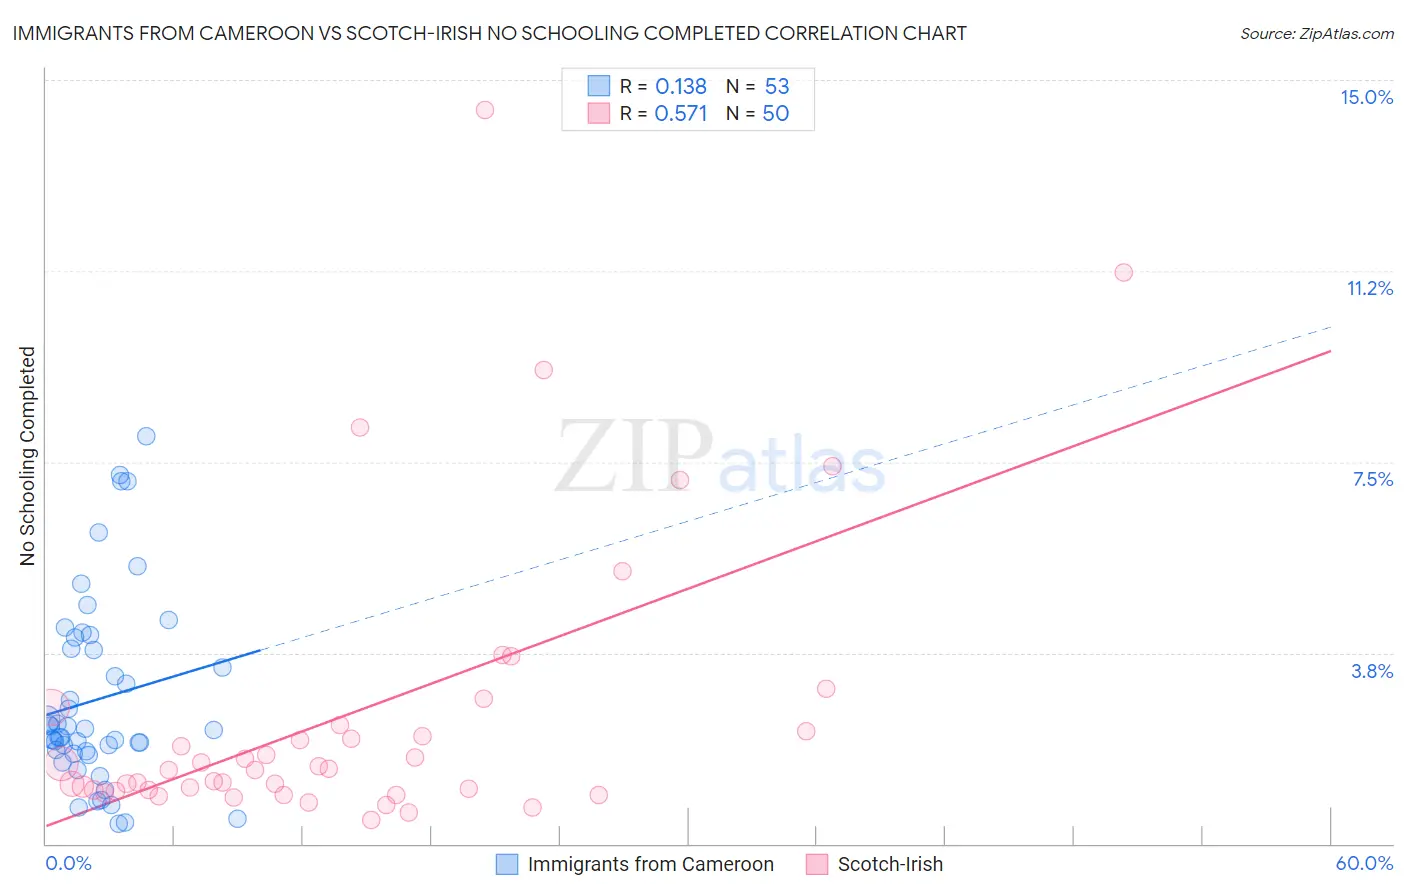
Immigrants from Cameroon vs Scotch-Irish No Schooling Completed Correlation Chart
The statistical analysis conducted on geographies consisting of 130,544,113 people shows a poor positive correlation between the proportion of Immigrants from Cameroon and percentage of population with no schooling in the United States with a correlation coefficient (R) of 0.138 and weighted average of 2.5%. Similarly, the statistical analysis conducted on geographies consisting of 532,641,930 people shows a substantial positive correlation between the proportion of Scotch-Irish and percentage of population with no schooling in the United States with a correlation coefficient (R) of 0.571 and weighted average of 1.5%, a difference of 75.6%.
No Schooling Completed Correlation Summary
| Measurement | Immigrants from Cameroon | Scotch-Irish |
| Minimum | 0.38% | 0.46% |
| Maximum | 8.0% | 14.4% |
| Range | 7.6% | 14.0% |
| Mean | 2.8% | 2.6% |
| Median | 2.2% | 1.5% |
| Interquartile 25% (IQ1) | 1.8% | 1.0% |
| Interquartile 75% (IQ3) | 3.9% | 2.3% |
| Interquartile Range (IQR) | 2.1% | 1.3% |
| Standard Deviation (Sample) | 1.8% | 2.9% |
| Standard Deviation (Population) | 1.8% | 2.9% |
Similar Demographics by No Schooling Completed
Demographics Similar to Immigrants from Cameroon by No Schooling Completed
In terms of no schooling completed, the demographic groups most similar to Immigrants from Cameroon are Ghanaian (2.6%, a difference of 0.37%), Immigrants from China (2.6%, a difference of 0.56%), Immigrants from Bolivia (2.5%, a difference of 0.79%), Immigrants from Western Africa (2.6%, a difference of 1.1%), and Immigrants from Philippines (2.6%, a difference of 1.2%).
| Demographics | Rating | Rank | No Schooling Completed |
| Fijians | 0.4 /100 | #266 | Tragic 2.5% |
| Yuman | 0.4 /100 | #267 | Tragic 2.5% |
| Taiwanese | 0.3 /100 | #268 | Tragic 2.5% |
| Immigrants | Nigeria | 0.2 /100 | #269 | Tragic 2.5% |
| Immigrants | Peru | 0.2 /100 | #270 | Tragic 2.5% |
| Cubans | 0.2 /100 | #271 | Tragic 2.5% |
| Immigrants | Bolivia | 0.2 /100 | #272 | Tragic 2.5% |
| Immigrants | Cameroon | 0.1 /100 | #273 | Tragic 2.5% |
| Ghanaians | 0.1 /100 | #274 | Tragic 2.6% |
| Immigrants | China | 0.1 /100 | #275 | Tragic 2.6% |
| Immigrants | Western Africa | 0.1 /100 | #276 | Tragic 2.6% |
| Immigrants | Philippines | 0.1 /100 | #277 | Tragic 2.6% |
| Immigrants | Uzbekistan | 0.1 /100 | #278 | Tragic 2.6% |
| Barbadians | 0.1 /100 | #279 | Tragic 2.6% |
| Trinidadians and Tobagonians | 0.1 /100 | #280 | Tragic 2.6% |
Demographics Similar to Scotch-Irish by No Schooling Completed
In terms of no schooling completed, the demographic groups most similar to Scotch-Irish are Tlingit-Haida (1.5%, a difference of 0.060%), Finnish (1.5%, a difference of 0.58%), Croatian (1.5%, a difference of 0.59%), Danish (1.5%, a difference of 0.89%), and Polish (1.4%, a difference of 0.94%).
| Demographics | Rating | Rank | No Schooling Completed |
| English | 100.0 /100 | #7 | Exceptional 1.4% |
| Swedes | 100.0 /100 | #8 | Exceptional 1.4% |
| Scottish | 100.0 /100 | #9 | Exceptional 1.4% |
| Dutch | 100.0 /100 | #10 | Exceptional 1.4% |
| Lithuanians | 100.0 /100 | #11 | Exceptional 1.4% |
| Irish | 100.0 /100 | #12 | Exceptional 1.4% |
| Poles | 100.0 /100 | #13 | Exceptional 1.4% |
| Scotch-Irish | 100.0 /100 | #14 | Exceptional 1.5% |
| Tlingit-Haida | 100.0 /100 | #15 | Exceptional 1.5% |
| Finns | 100.0 /100 | #16 | Exceptional 1.5% |
| Croatians | 100.0 /100 | #17 | Exceptional 1.5% |
| Danes | 100.0 /100 | #18 | Exceptional 1.5% |
| Alaskan Athabascans | 100.0 /100 | #19 | Exceptional 1.5% |
| Welsh | 100.0 /100 | #20 | Exceptional 1.5% |
| Chinese | 100.0 /100 | #21 | Exceptional 1.5% |