Immigrants from Armenia vs Immigrants from Central America College, 1 year or more
COMPARE
Immigrants from Armenia
Immigrants from Central America
College, 1 year or more
College, 1 year or more Comparison
Immigrants from Armenia
Immigrants from Central America
60.0%
COLLEGE, 1 YEAR OR MORE
68.8/ 100
METRIC RATING
157th/ 347
METRIC RANK
48.5%
COLLEGE, 1 YEAR OR MORE
0.0/ 100
METRIC RATING
338th/ 347
METRIC RANK
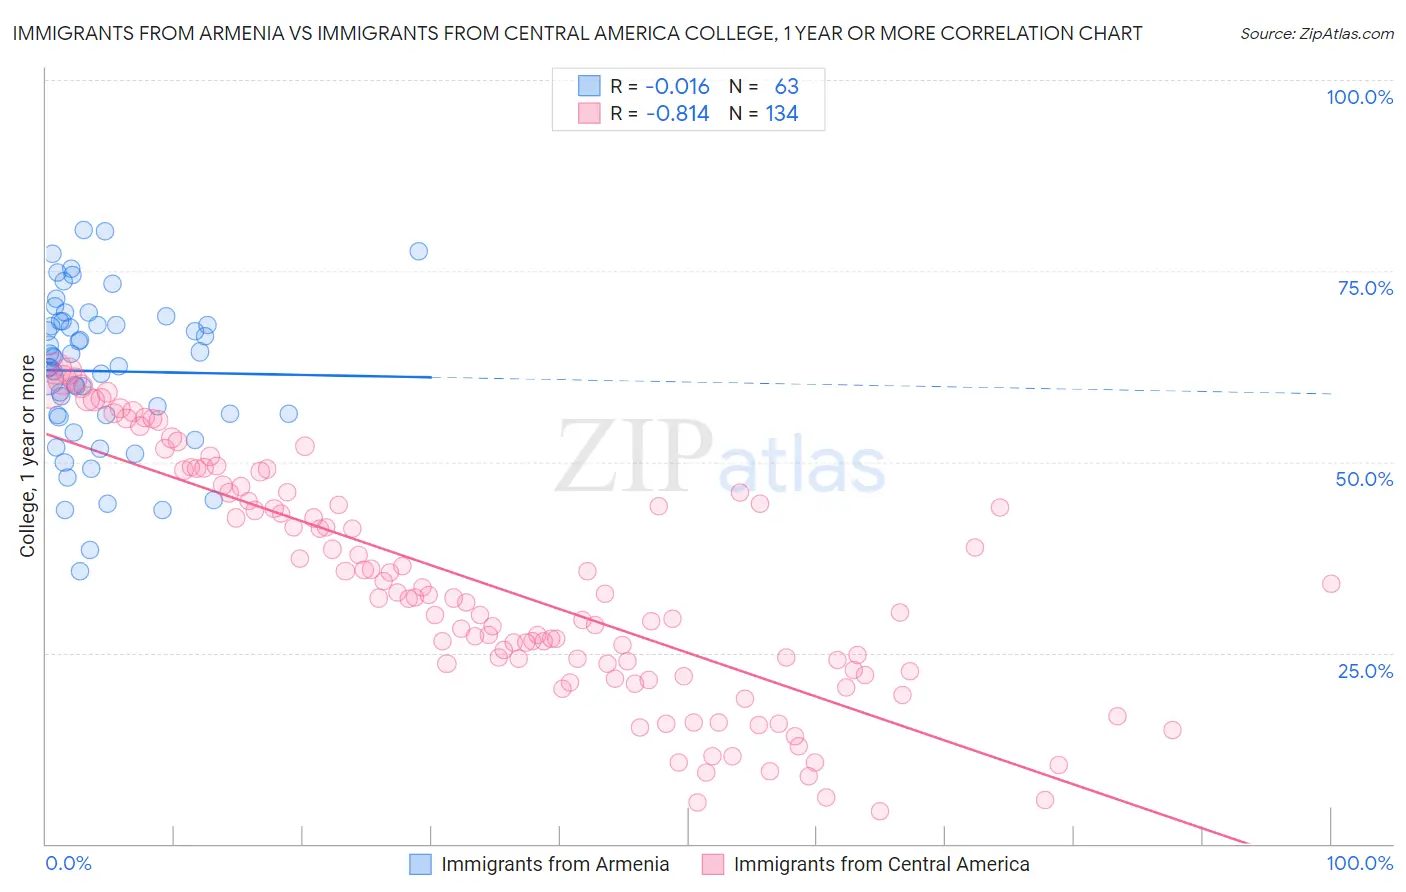
Immigrants from Armenia vs Immigrants from Central America College, 1 year or more Correlation Chart
The statistical analysis conducted on geographies consisting of 97,725,183 people shows no correlation between the proportion of Immigrants from Armenia and percentage of population with at least college, 1 year or more education in the United States with a correlation coefficient (R) of -0.016 and weighted average of 60.0%. Similarly, the statistical analysis conducted on geographies consisting of 536,538,843 people shows a very strong negative correlation between the proportion of Immigrants from Central America and percentage of population with at least college, 1 year or more education in the United States with a correlation coefficient (R) of -0.814 and weighted average of 48.5%, a difference of 23.8%.
College, 1 year or more Correlation Summary
| Measurement | Immigrants from Armenia | Immigrants from Central America |
| Minimum | 35.7% | 4.2% |
| Maximum | 80.4% | 62.3% |
| Range | 44.7% | 58.1% |
| Mean | 61.9% | 33.7% |
| Median | 63.7% | 32.2% |
| Interquartile 25% (IQ1) | 56.2% | 22.8% |
| Interquartile 75% (IQ3) | 68.3% | 46.0% |
| Interquartile Range (IQR) | 12.2% | 23.2% |
| Standard Deviation (Sample) | 10.1% | 15.2% |
| Standard Deviation (Population) | 10.0% | 15.2% |
Similar Demographics by College, 1 year or more
Demographics Similar to Immigrants from Armenia by College, 1 year or more
In terms of college, 1 year or more, the demographic groups most similar to Immigrants from Armenia are English (60.0%, a difference of 0.10%), Immigrants from Iraq (60.0%, a difference of 0.11%), South American Indian (60.0%, a difference of 0.12%), Somali (59.9%, a difference of 0.25%), and Sudanese (60.2%, a difference of 0.26%).
| Demographics | Rating | Rank | College, 1 year or more |
| Immigrants | Sudan | 77.8 /100 | #150 | Good 60.4% |
| Albanians | 77.8 /100 | #151 | Good 60.4% |
| Immigrants | Germany | 76.1 /100 | #152 | Good 60.3% |
| Sierra Leoneans | 74.1 /100 | #153 | Good 60.2% |
| Sudanese | 73.0 /100 | #154 | Good 60.2% |
| Moroccans | 72.9 /100 | #155 | Good 60.2% |
| Finns | 72.9 /100 | #156 | Good 60.2% |
| Immigrants | Armenia | 68.8 /100 | #157 | Good 60.0% |
| English | 67.2 /100 | #158 | Good 60.0% |
| Immigrants | Iraq | 67.0 /100 | #159 | Good 60.0% |
| South American Indians | 66.9 /100 | #160 | Good 60.0% |
| Somalis | 64.5 /100 | #161 | Good 59.9% |
| Koreans | 58.5 /100 | #162 | Average 59.7% |
| Immigrants | Somalia | 58.3 /100 | #163 | Average 59.7% |
| Belgians | 58.1 /100 | #164 | Average 59.7% |
Demographics Similar to Immigrants from Central America by College, 1 year or more
In terms of college, 1 year or more, the demographic groups most similar to Immigrants from Central America are Pennsylvania German (48.5%, a difference of 0.050%), Spanish American Indian (48.5%, a difference of 0.060%), Immigrants from the Azores (48.4%, a difference of 0.26%), Yuman (48.7%, a difference of 0.50%), and Lumbee (48.9%, a difference of 0.78%).
| Demographics | Rating | Rank | College, 1 year or more |
| Immigrants | Yemen | 0.0 /100 | #331 | Tragic 50.0% |
| Mexicans | 0.0 /100 | #332 | Tragic 49.2% |
| Immigrants | Dominican Republic | 0.0 /100 | #333 | Tragic 49.1% |
| Lumbee | 0.0 /100 | #334 | Tragic 48.9% |
| Yuman | 0.0 /100 | #335 | Tragic 48.7% |
| Spanish American Indians | 0.0 /100 | #336 | Tragic 48.5% |
| Pennsylvania Germans | 0.0 /100 | #337 | Tragic 48.5% |
| Immigrants | Central America | 0.0 /100 | #338 | Tragic 48.5% |
| Immigrants | Azores | 0.0 /100 | #339 | Tragic 48.4% |
| Immigrants | Cabo Verde | 0.0 /100 | #340 | Tragic 48.1% |
| Immigrants | Mexico | 0.0 /100 | #341 | Tragic 47.5% |
| Inupiat | 0.0 /100 | #342 | Tragic 47.2% |
| Tohono O'odham | 0.0 /100 | #343 | Tragic 47.1% |
| Yakama | 0.0 /100 | #344 | Tragic 46.2% |
| Pima | 0.0 /100 | #345 | Tragic 45.6% |