German vs Bhutanese No Schooling Completed

COMPARE

German
Race
Ancestry
AfghanAfricanAlaska NativeAlaskan AthabascanAlbanianAleutAlsatianAmericanApacheArabArapahoArgentineanArmenianAssyrian/Chaldean/SyriacAustralianAustrianBahamianBangladeshiBarbadianBasqueBelgianBelizeanBermudanBlackfeetBolivianBrazilianBritishBritish West IndianBulgarianBurmeseCajunCambodianCanadianCape VerdeanCarpatho RusynCelticCentral AmericanCentral American IndianCherokeeCheyenneChickasawChileanChineseChippewaChoctawColombianColvilleComancheCosta RicanCreeCreekCroatianCrowCubanCypriotCzechCzechoslovakianDanishDelawareDominicanDutchDutch West IndianEastern EuropeanEcuadorianEgyptianEnglishEstonianEthiopianEuropeanFijianFilipinoFinnishFrenchFrench American IndianFrench CanadianGermanGerman RussianGhanaianGreekGuamanian/ChamorroGuatemalanGuyaneseHaitianHmongHonduranHopiHoumaHungarianIcelanderIndian (Asian)IndonesianInupiatIranianIraqiIrishIroquoisIsraeliItalianJamaicanJapaneseJordanianKenyanKiowaKoreanLaotianLatvianLebaneseLiberianLithuanianLumbeeLuxembourgerMacedonianMalaysianMalteseMarshalleseMenomineeMexicanMexican American IndianMongolianMoroccanNative HawaiianNavajoNepaleseNew ZealanderNicaraguanNigerianNorthern EuropeanNorwegianOkinawanOsageOttawaPaiutePakistaniPalestinianPanamanianParaguayanPennsylvania GermanPeruvianPimaPolishPortuguesePotawatomiPuebloPuerto RicanPuget Sound SalishRomanianRussianSalvadoranSamoanScandinavianScotch-IrishScottishSeminoleSenegaleseSerbianShoshoneSierra LeoneanSiouxSlavicSlovakSloveneSomaliSouth AfricanSouth AmericanSouth American IndianSoviet UnionSpaniardSpanishSpanish AmericanSpanish American IndianSri LankanSubsaharan AfricanSudaneseSwedishSwissSyrianTaiwaneseThaiTlingit-HaidaTohono O'OdhamTonganTrinidadian and TobagonianTsimshianTurkishU.S. Virgin IslanderUgandanUkrainianUruguayanUteVenezuelanVietnameseWelshWest IndianYakamaYaquiYugoslavianYumanYup'ikZimbabwean
Immigration
NonimmigrantsImmigrantsAfghanistanAfricaAlbaniaArgentinaArmeniaAsiaAustraliaAustriaBahamasBangladeshBarbadosBelarusBelgiumBelizeBoliviaBosnia and HerzegovinaBrazilBulgariaBurma/MyanmarCabo VerdeCambodiaCameroonCanadaCaribbeanCentral AmericaChileChinaColombiaCongoCosta RicaCroatiaCubaCzechoslovakiaDenmarkDominicaDominican RepublicEastern AfricaEastern AsiaEastern EuropeEcuadorEgyptEl SalvadorEnglandEritreaEthiopiaEuropeFijiFranceGermanyGhanaGreeceGrenadaGuatemalaGuyanaHaitiHondurasHong KongHungaryIndiaIndonesiaIranIraqIrelandIsraelItalyJamaicaJapanJordanKazakhstanKenyaKoreaKuwaitLaosLatin AmericaLatviaLebanonLiberiaLithuaniaMalaysiaMexicoMicronesiaMiddle AfricaMoldovaMoroccoNepalNetherlandsNicaraguaNigeriaNorth AmericaNorth MacedoniaNorthern AfricaNorthern EuropeNorwayOceaniaPakistanPanamaPeruPhilippinesPolandPortugalRomaniaRussiaSaudi ArabiaScotlandSenegalSerbiaSierra LeoneSingaporeSomaliaSouth AfricaSouth AmericaSouth Central AsiaSouth Eastern AsiaSouthern EuropeSpainSri LankaSt. Vincent and the GrenadinesSudanSwedenSwitzerlandSyriaTaiwanThailandTrinidad and TobagoTurkeyUgandaUkraineUruguayUzbekistanVenezuelaVietnamWest IndiesWestern AfricaWestern AsiaWestern EuropeYemenZaireZimbabweAzores
Bhutanese
Race
Ancestry
AfghanAfricanAlaska NativeAlaskan AthabascanAlbanianAleutAlsatianAmericanApacheArabArapahoArgentineanArmenianAssyrian/Chaldean/SyriacAustralianAustrianBahamianBangladeshiBarbadianBasqueBelgianBelizeanBermudanBhutaneseBlackfeetBolivianBrazilianBritishBritish West IndianBulgarianBurmeseCajunCambodianCanadianCape VerdeanCarpatho RusynCelticCentral AmericanCentral American IndianCherokeeCheyenneChickasawChileanChineseChippewaChoctawColombianColvilleComancheCosta RicanCreeCreekCroatianCrowCubanCypriotCzechCzechoslovakianDanishDelawareDominicanDutchDutch West IndianEastern EuropeanEcuadorianEgyptianEnglishEstonianEthiopianEuropeanFijianFilipinoFinnishFrenchFrench American IndianFrench CanadianGerman RussianGhanaianGreekGuamanian/ChamorroGuatemalanGuyaneseHaitianHmongHonduranHopiHoumaHungarianIcelanderIndian (Asian)IndonesianInupiatIranianIraqiIrishIroquoisIsraeliItalianJamaicanJapaneseJordanianKenyanKiowaKoreanLaotianLatvianLebaneseLiberianLithuanianLumbeeLuxembourgerMacedonianMalaysianMalteseMarshalleseMenomineeMexicanMexican American IndianMongolianMoroccanNative HawaiianNavajoNepaleseNew ZealanderNicaraguanNigerianNorthern EuropeanNorwegianOkinawanOsageOttawaPaiutePakistaniPalestinianPanamanianParaguayanPennsylvania GermanPeruvianPimaPolishPortuguesePotawatomiPuebloPuerto RicanPuget Sound SalishRomanianRussianSalvadoranSamoanScandinavianScotch-IrishScottishSeminoleSenegaleseSerbianShoshoneSierra LeoneanSiouxSlavicSlovakSloveneSomaliSouth AfricanSouth AmericanSouth American IndianSoviet UnionSpaniardSpanishSpanish AmericanSpanish American IndianSri LankanSubsaharan AfricanSudaneseSwedishSwissSyrianTaiwaneseThaiTlingit-HaidaTohono O'OdhamTonganTrinidadian and TobagonianTsimshianTurkishU.S. Virgin IslanderUgandanUkrainianUruguayanUteVenezuelanVietnameseWelshWest IndianYakamaYaquiYugoslavianYumanYup'ikZimbabwean
Immigration
NonimmigrantsImmigrantsAfghanistanAfricaAlbaniaArgentinaArmeniaAsiaAustraliaAustriaBahamasBangladeshBarbadosBelarusBelgiumBelizeBoliviaBosnia and HerzegovinaBrazilBulgariaBurma/MyanmarCabo VerdeCambodiaCameroonCanadaCaribbeanCentral AmericaChileChinaColombiaCongoCosta RicaCroatiaCubaCzechoslovakiaDenmarkDominicaDominican RepublicEastern AfricaEastern AsiaEastern EuropeEcuadorEgyptEl SalvadorEnglandEritreaEthiopiaEuropeFijiFranceGermanyGhanaGreeceGrenadaGuatemalaGuyanaHaitiHondurasHong KongHungaryIndiaIndonesiaIranIraqIrelandIsraelItalyJamaicaJapanJordanKazakhstanKenyaKoreaKuwaitLaosLatin AmericaLatviaLebanonLiberiaLithuaniaMalaysiaMexicoMicronesiaMiddle AfricaMoldovaMoroccoNepalNetherlandsNicaraguaNigeriaNorth AmericaNorth MacedoniaNorthern AfricaNorthern EuropeNorwayOceaniaPakistanPanamaPeruPhilippinesPolandPortugalRomaniaRussiaSaudi ArabiaScotlandSenegalSerbiaSierra LeoneSingaporeSomaliaSouth AfricaSouth AmericaSouth Central AsiaSouth Eastern AsiaSouthern EuropeSpainSri LankaSt. Vincent and the GrenadinesSudanSwedenSwitzerlandSyriaTaiwanThailandTrinidad and TobagoTurkeyUgandaUkraineUruguayUzbekistanVenezuelaVietnamWest IndiesWestern AfricaWestern AsiaWestern EuropeYemenZaireZimbabweAzores
No Schooling Completed
Income
Poverty
Unemployment
Labor Participation
Family Structure
Vehicle Availability
Education Level
Disability

No Schooling Completed Comparison

Germans

Bhutanese

Exceptional
Exceptional
1.4%
NO SCHOOLING COMPLETED
100.0/ 100
METRIC RATING
4th/ 347
METRIC RANK
1.8%
NO SCHOOLING COMPLETED
98.4/ 100
METRIC RATING
96th/ 347
METRIC RANK

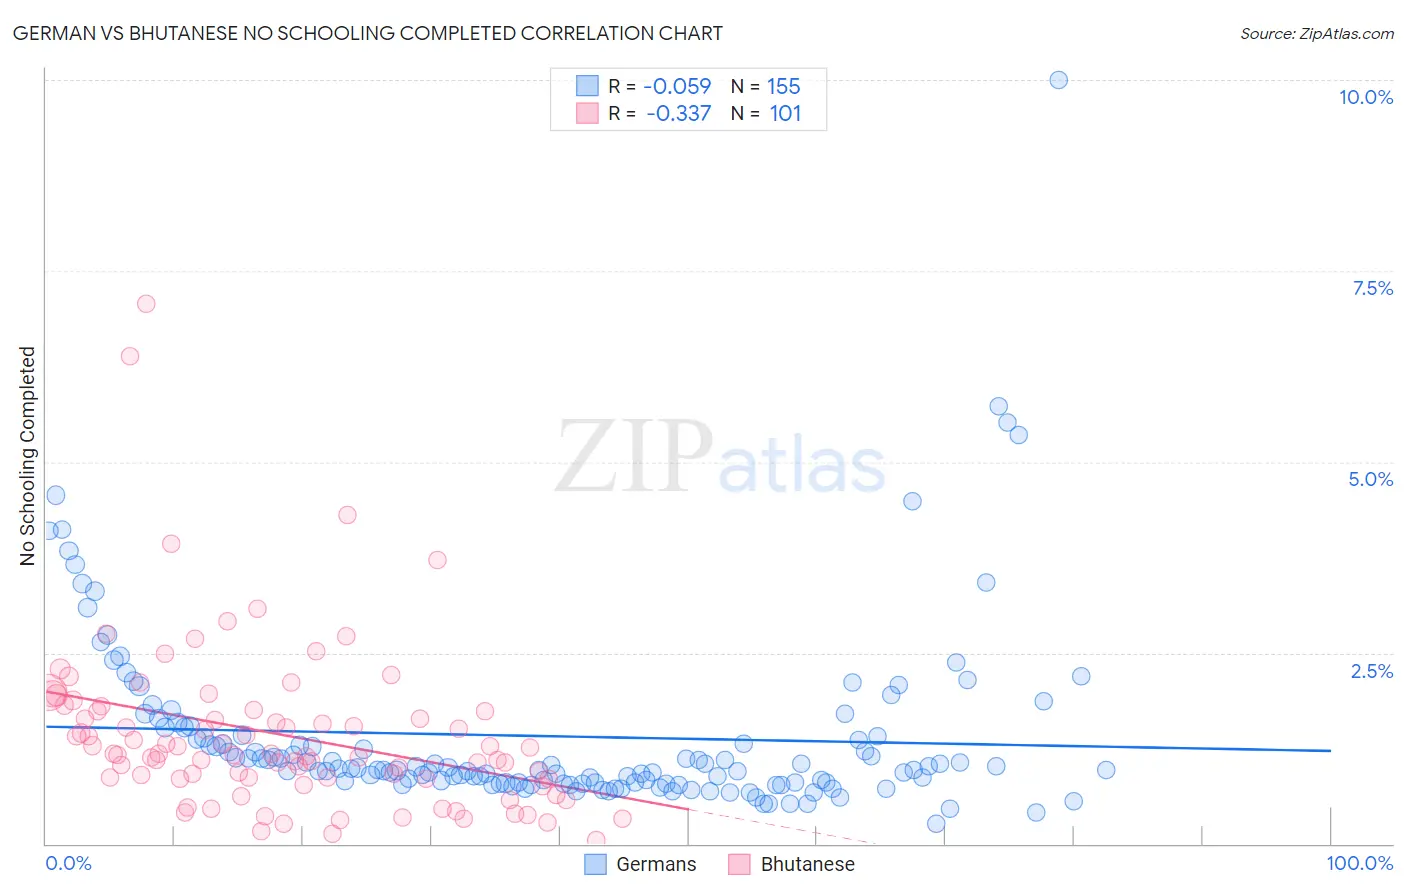
German vs Bhutanese No Schooling Completed Correlation Chart

The statistical analysis conducted on geographies consisting of 559,407,426 people shows a slight negative correlation between the proportion of Germans and percentage of population with no schooling in the United States with a correlation coefficient (R) of -0.059 and weighted average of 1.4%. Similarly, the statistical analysis conducted on geographies consisting of 448,858,455 people shows a mild negative correlation between the proportion of Bhutanese and percentage of population with no schooling in the United States with a correlation coefficient (R) of -0.337 and weighted average of 1.8%, a difference of 32.8%.
German vs Bhutanese No Schooling Completed

No Schooling Completed Correlation Summary

MeasurementGermanBhutanese
Minimum0.26%0.048%
Maximum10.0%7.1%
Range9.7%7.0%
Mean1.4%1.4%
Median0.98%1.2%
Interquartile 25% (IQ1)0.80%0.85%
Interquartile 75% (IQ3)1.4%1.7%
Interquartile Range (IQR)0.61%0.89%
Standard Deviation (Sample)1.2%1.1%
Standard Deviation (Population)1.2%1.1%

Similar Demographics by No Schooling Completed

Demographics Similar to Germans by No Schooling Completed

In terms of no schooling completed, the demographic groups most similar to Germans are Slovene (1.4%, a difference of 0.42%), Norwegian (1.3%, a difference of 0.56%), Slovak (1.3%, a difference of 0.99%), Carpatho Rusyn (1.4%, a difference of 1.2%), and English (1.4%, a difference of 2.2%).
DemographicsRating | RankNo Schooling Completed
Yup'ik
100.0
/100
|
#1
Exceptional
1.2%
Slovaks
100.0
/100
|
#2
Exceptional
1.3%
Norwegians
100.0
/100
|
#3
Exceptional
1.3%
Germans
100.0
/100
|
#4
Exceptional
1.4%
Slovenes
100.0
/100
|
#5
Exceptional
1.4%
Carpatho Rusyns
100.0
/100
|
#6
Exceptional
1.4%
English
100.0
/100
|
#7
Exceptional
1.4%
Swedes
100.0
/100
|
#8
Exceptional
1.4%
Scottish
100.0
/100
|
#9
Exceptional
1.4%
Dutch
100.0
/100
|
#10
Exceptional
1.4%
Lithuanians
100.0
/100
|
#11
Exceptional
1.4%
Irish
100.0
/100
|
#12
Exceptional
1.4%
Poles
100.0
/100
|
#13
Exceptional
1.4%
Scotch-Irish
100.0
/100
|
#14
Exceptional
1.5%
Tlingit-Haida
100.0
/100
|
#15
Exceptional
1.5%

Demographics Similar to Bhutanese by No Schooling Completed

In terms of no schooling completed, the demographic groups most similar to Bhutanese are Immigrants from Ireland (1.8%, a difference of 0.18%), Puget Sound Salish (1.8%, a difference of 0.23%), Nonimmigrants (1.8%, a difference of 0.24%), Iranian (1.8%, a difference of 0.46%), and Choctaw (1.8%, a difference of 0.65%).
DemographicsRating | RankNo Schooling Completed
South Africans
99.1
/100
|
#89
Exceptional
1.8%
Sioux
99.0
/100
|
#90
Exceptional
1.8%
Immigrants | Germany
99.0
/100
|
#91
Exceptional
1.8%
Romanians
98.8
/100
|
#92
Exceptional
1.8%
Turks
98.7
/100
|
#93
Exceptional
1.8%
Immigrants | Nonimmigrants
98.5
/100
|
#94
Exceptional
1.8%
Puget Sound Salish
98.5
/100
|
#95
Exceptional
1.8%
Bhutanese
98.4
/100
|
#96
Exceptional
1.8%
Immigrants | Ireland
98.4
/100
|
#97
Exceptional
1.8%
Iranians
98.2
/100
|
#98
Exceptional
1.8%
Choctaw
98.1
/100
|
#99
Exceptional
1.8%
Immigrants | Singapore
98.0
/100
|
#100
Exceptional
1.8%
Immigrants | Czechoslovakia
97.9
/100
|
#101
Exceptional
1.8%
Immigrants | Switzerland
97.9
/100
|
#102
Exceptional
1.8%
Basques
97.9
/100
|
#103
Exceptional
1.8%