English vs Immigrants from Peru Doctorate Degree

COMPARE

English
Race
Ancestry
AfghanAfricanAlaska NativeAlaskan AthabascanAlbanianAleutAlsatianAmericanApacheArabArapahoArgentineanArmenianAssyrian/Chaldean/SyriacAustralianAustrianBahamianBangladeshiBarbadianBasqueBelgianBelizeanBermudanBhutaneseBlackfeetBolivianBrazilianBritishBritish West IndianBulgarianBurmeseCajunCambodianCanadianCape VerdeanCarpatho RusynCelticCentral AmericanCentral American IndianCherokeeCheyenneChickasawChileanChineseChippewaChoctawColombianColvilleComancheCosta RicanCreeCreekCroatianCrowCubanCypriotCzechCzechoslovakianDanishDelawareDominicanDutchDutch West IndianEastern EuropeanEcuadorianEgyptianEnglishEstonianEthiopianEuropeanFijianFilipinoFinnishFrenchFrench American IndianFrench CanadianGermanGerman RussianGhanaianGreekGuamanian/ChamorroGuatemalanGuyaneseHaitianHmongHonduranHopiHoumaHungarianIcelanderIndian (Asian)IndonesianInupiatIranianIraqiIrishIroquoisIsraeliItalianJamaicanJapaneseJordanianKenyanKiowaKoreanLaotianLatvianLebaneseLiberianLithuanianLumbeeLuxembourgerMacedonianMalaysianMalteseMarshalleseMenomineeMexicanMexican American IndianMongolianMoroccanNative HawaiianNavajoNepaleseNew ZealanderNicaraguanNigerianNorthern EuropeanNorwegianOkinawanOsageOttawaPaiutePakistaniPalestinianPanamanianParaguayanPennsylvania GermanPeruvianPimaPolishPortuguesePotawatomiPuebloPuerto RicanPuget Sound SalishRomanianRussianSalvadoranSamoanScandinavianScotch-IrishScottishSeminoleSenegaleseSerbianShoshoneSierra LeoneanSiouxSlavicSlovakSloveneSomaliSouth AfricanSouth AmericanSouth American IndianSoviet UnionSpaniardSpanishSpanish AmericanSpanish American IndianSri LankanSubsaharan AfricanSudaneseSwedishSwissSyrianTaiwaneseThaiTlingit-HaidaTohono O'OdhamTonganTrinidadian and TobagonianTsimshianTurkishU.S. Virgin IslanderUgandanUkrainianUruguayanUteVenezuelanVietnameseWelshWest IndianYakamaYaquiYugoslavianYumanYup'ikZimbabwean
Immigration
NonimmigrantsImmigrantsAfghanistanAfricaAlbaniaArgentinaArmeniaAsiaAustraliaAustriaBahamasBangladeshBarbadosBelarusBelgiumBelizeBoliviaBosnia and HerzegovinaBrazilBulgariaBurma/MyanmarCabo VerdeCambodiaCameroonCanadaCaribbeanCentral AmericaChileChinaColombiaCongoCosta RicaCroatiaCubaCzechoslovakiaDenmarkDominicaDominican RepublicEastern AfricaEastern AsiaEastern EuropeEcuadorEgyptEl SalvadorEnglandEritreaEthiopiaEuropeFijiFranceGermanyGhanaGreeceGrenadaGuatemalaGuyanaHaitiHondurasHong KongHungaryIndiaIndonesiaIranIraqIrelandIsraelItalyJamaicaJapanJordanKazakhstanKenyaKoreaKuwaitLaosLatin AmericaLatviaLebanonLiberiaLithuaniaMalaysiaMexicoMicronesiaMiddle AfricaMoldovaMoroccoNepalNetherlandsNicaraguaNigeriaNorth AmericaNorth MacedoniaNorthern AfricaNorthern EuropeNorwayOceaniaPakistanPanamaPhilippinesPolandPortugalRomaniaRussiaSaudi ArabiaScotlandSenegalSerbiaSierra LeoneSingaporeSomaliaSouth AfricaSouth AmericaSouth Central AsiaSouth Eastern AsiaSouthern EuropeSpainSri LankaSt. Vincent and the GrenadinesSudanSwedenSwitzerlandSyriaTaiwanThailandTrinidad and TobagoTurkeyUgandaUkraineUruguayUzbekistanVenezuelaVietnamWest IndiesWestern AfricaWestern AsiaWestern EuropeYemenZaireZimbabweAzores
Immigrants from Peru
Race
Ancestry
AfghanAfricanAlaska NativeAlaskan AthabascanAlbanianAleutAlsatianAmericanApacheArabArapahoArgentineanArmenianAssyrian/Chaldean/SyriacAustralianAustrianBahamianBangladeshiBarbadianBasqueBelgianBelizeanBermudanBhutaneseBlackfeetBolivianBrazilianBritishBritish West IndianBulgarianBurmeseCajunCambodianCanadianCape VerdeanCarpatho RusynCelticCentral AmericanCentral American IndianCherokeeCheyenneChickasawChileanChineseChippewaChoctawColombianColvilleComancheCosta RicanCreeCreekCroatianCrowCubanCypriotCzechCzechoslovakianDanishDelawareDominicanDutchDutch West IndianEastern EuropeanEcuadorianEgyptianEstonianEthiopianEuropeanFijianFilipinoFinnishFrenchFrench American IndianFrench CanadianGermanGerman RussianGhanaianGreekGuamanian/ChamorroGuatemalanGuyaneseHaitianHmongHonduranHopiHoumaHungarianIcelanderIndian (Asian)IndonesianInupiatIranianIraqiIrishIroquoisIsraeliItalianJamaicanJapaneseJordanianKenyanKiowaKoreanLaotianLatvianLebaneseLiberianLithuanianLumbeeLuxembourgerMacedonianMalaysianMalteseMarshalleseMenomineeMexicanMexican American IndianMongolianMoroccanNative HawaiianNavajoNepaleseNew ZealanderNicaraguanNigerianNorthern EuropeanNorwegianOkinawanOsageOttawaPaiutePakistaniPalestinianPanamanianParaguayanPennsylvania GermanPeruvianPimaPolishPortuguesePotawatomiPuebloPuerto RicanPuget Sound SalishRomanianRussianSalvadoranSamoanScandinavianScotch-IrishScottishSeminoleSenegaleseSerbianShoshoneSierra LeoneanSiouxSlavicSlovakSloveneSomaliSouth AfricanSouth AmericanSouth American IndianSoviet UnionSpaniardSpanishSpanish AmericanSpanish American IndianSri LankanSubsaharan AfricanSudaneseSwedishSwissSyrianTaiwaneseThaiTlingit-HaidaTohono O'OdhamTonganTrinidadian and TobagonianTsimshianTurkishU.S. Virgin IslanderUgandanUkrainianUruguayanUteVenezuelanVietnameseWelshWest IndianYakamaYaquiYugoslavianYumanYup'ikZimbabwean
Immigration
NonimmigrantsImmigrantsAfghanistanAfricaAlbaniaArgentinaArmeniaAsiaAustraliaAustriaBahamasBangladeshBarbadosBelarusBelgiumBelizeBoliviaBosnia and HerzegovinaBrazilBulgariaBurma/MyanmarCabo VerdeCambodiaCameroonCanadaCaribbeanCentral AmericaChileChinaColombiaCongoCosta RicaCroatiaCubaCzechoslovakiaDenmarkDominicaDominican RepublicEastern AfricaEastern AsiaEastern EuropeEcuadorEgyptEl SalvadorEnglandEritreaEthiopiaEuropeFijiFranceGermanyGhanaGreeceGrenadaGuatemalaGuyanaHaitiHondurasHong KongHungaryIndiaIndonesiaIranIraqIrelandIsraelItalyJamaicaJapanJordanKazakhstanKenyaKoreaKuwaitLaosLatin AmericaLatviaLebanonLiberiaLithuaniaMalaysiaMexicoMicronesiaMiddle AfricaMoldovaMoroccoNepalNetherlandsNicaraguaNigeriaNorth AmericaNorth MacedoniaNorthern AfricaNorthern EuropeNorwayOceaniaPakistanPanamaPeruPhilippinesPolandPortugalRomaniaRussiaSaudi ArabiaScotlandSenegalSerbiaSierra LeoneSingaporeSomaliaSouth AfricaSouth AmericaSouth Central AsiaSouth Eastern AsiaSouthern EuropeSpainSri LankaSt. Vincent and the GrenadinesSudanSwedenSwitzerlandSyriaTaiwanThailandTrinidad and TobagoTurkeyUgandaUkraineUruguayUzbekistanVenezuelaVietnamWest IndiesWestern AfricaWestern AsiaWestern EuropeYemenZaireZimbabweAzores
Doctorate Degree
Income
Poverty
Unemployment
Labor Participation
Family Structure
Vehicle Availability
Education Level
Disability

Doctorate Degree Comparison

English

Immigrants from Peru

Good
Poor
1.9%
DOCTORATE DEGREE
75.9/ 100
METRIC RATING
150th/ 347
METRIC RANK
1.7%
DOCTORATE DEGREE
17.6/ 100
METRIC RATING
206th/ 347
METRIC RANK

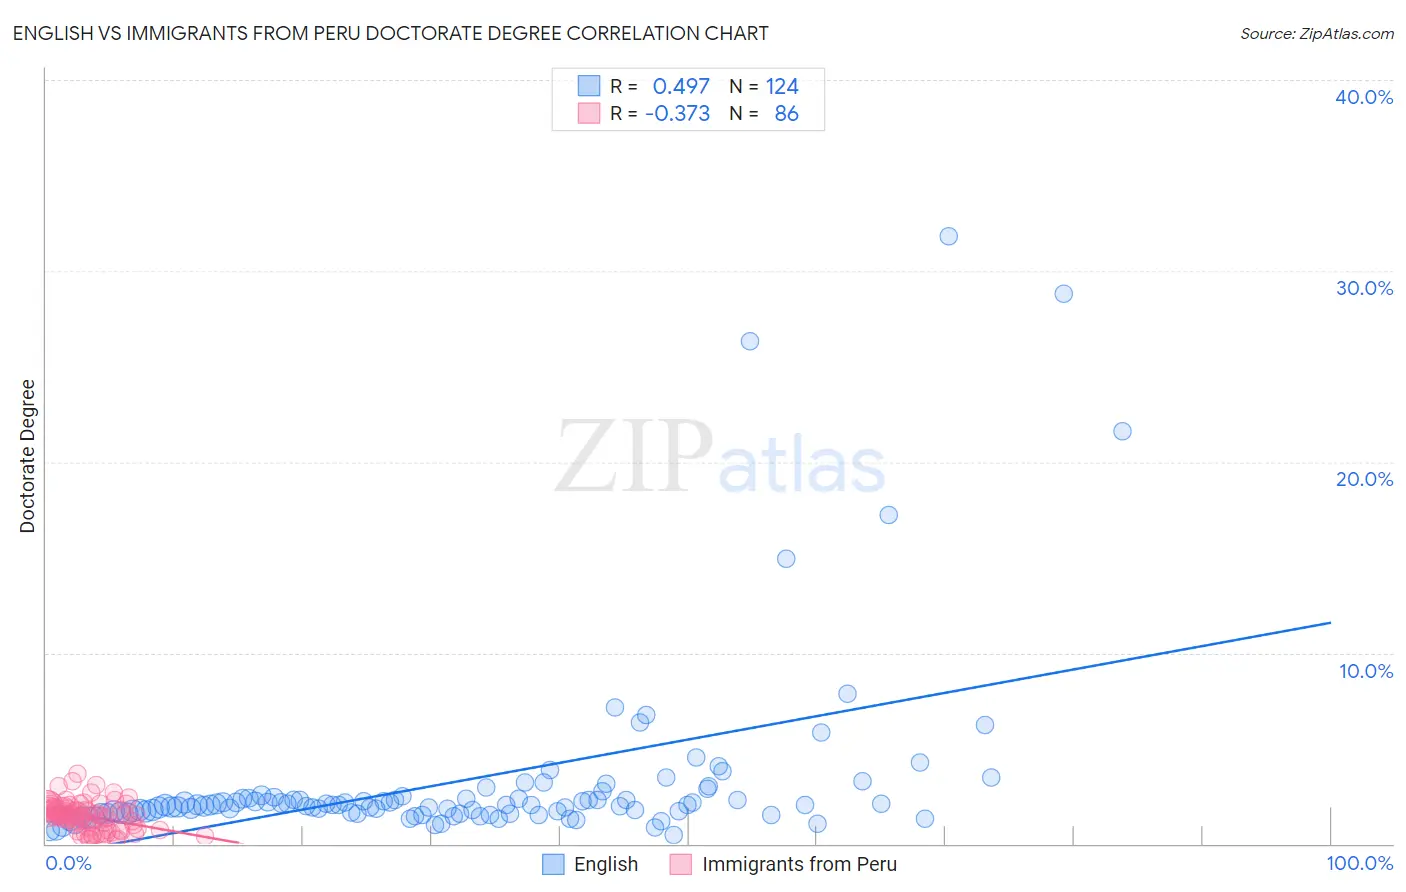
English vs Immigrants from Peru Doctorate Degree Correlation Chart

The statistical analysis conducted on geographies consisting of 550,351,908 people shows a moderate positive correlation between the proportion of English and percentage of population with at least doctorate degree education in the United States with a correlation coefficient (R) of 0.497 and weighted average of 1.9%. Similarly, the statistical analysis conducted on geographies consisting of 327,090,544 people shows a mild negative correlation between the proportion of Immigrants from Peru and percentage of population with at least doctorate degree education in the United States with a correlation coefficient (R) of -0.373 and weighted average of 1.7%, a difference of 10.4%.
English vs Immigrants from Peru Doctorate Degree

Doctorate Degree Correlation Summary

MeasurementEnglishImmigrants from Peru
Minimum0.49%0.18%
Maximum31.8%3.6%
Range31.3%3.5%
Mean3.3%1.5%
Median2.0%1.5%
Interquartile 25% (IQ1)1.6%0.85%
Interquartile 75% (IQ3)2.4%1.8%
Interquartile Range (IQR)0.77%0.98%
Standard Deviation (Sample)4.9%0.73%
Standard Deviation (Population)4.9%0.72%

Similar Demographics by Doctorate Degree

Demographics Similar to English by Doctorate Degree

In terms of doctorate degree, the demographic groups most similar to English are Albanian (1.9%, a difference of 0.19%), Basque (1.9%, a difference of 0.20%), Immigrants from Kenya (1.9%, a difference of 0.30%), Immigrants from Oceania (1.9%, a difference of 0.34%), and Immigrants from Albania (1.9%, a difference of 0.57%).
DemographicsRating | RankDoctorate Degree
Sierra Leoneans
85.1
/100
|
#143
Excellent
2.0%
Immigrants | Moldova
84.3
/100
|
#144
Excellent
2.0%
Kenyans
83.6
/100
|
#145
Excellent
1.9%
Immigrants | Syria
83.6
/100
|
#146
Excellent
1.9%
Immigrants | Senegal
82.5
/100
|
#147
Excellent
1.9%
Luxembourgers
81.1
/100
|
#148
Excellent
1.9%
Basques
76.9
/100
|
#149
Good
1.9%
English
75.9
/100
|
#150
Good
1.9%
Albanians
74.8
/100
|
#151
Good
1.9%
Immigrants | Kenya
74.3
/100
|
#152
Good
1.9%
Immigrants | Oceania
74.0
/100
|
#153
Good
1.9%
Immigrants | Albania
72.8
/100
|
#154
Good
1.9%
Poles
72.7
/100
|
#155
Good
1.9%
Slavs
72.4
/100
|
#156
Good
1.9%
Danes
71.9
/100
|
#157
Good
1.9%

Demographics Similar to Immigrants from Peru by Doctorate Degree

In terms of doctorate degree, the demographic groups most similar to Immigrants from Peru are Yugoslavian (1.7%, a difference of 0.16%), Colombian (1.7%, a difference of 0.44%), Venezuelan (1.7%, a difference of 0.48%), Immigrants from Western Africa (1.7%, a difference of 0.63%), and Tongan (1.7%, a difference of 0.71%).
DemographicsRating | RankDoctorate Degree
Immigrants | South America
23.3
/100
|
#199
Fair
1.8%
Whites/Caucasians
22.8
/100
|
#200
Fair
1.8%
Immigrants | Nigeria
22.4
/100
|
#201
Fair
1.8%
Portuguese
21.4
/100
|
#202
Fair
1.8%
Immigrants | Vietnam
21.4
/100
|
#203
Fair
1.8%
Somalis
21.2
/100
|
#204
Fair
1.7%
Venezuelans
19.5
/100
|
#205
Poor
1.7%
Immigrants | Peru
17.6
/100
|
#206
Poor
1.7%
Yugoslavians
17.1
/100
|
#207
Poor
1.7%
Colombians
16.1
/100
|
#208
Poor
1.7%
Immigrants | Western Africa
15.4
/100
|
#209
Poor
1.7%
Tongans
15.1
/100
|
#210
Poor
1.7%
Immigrants | Armenia
15.1
/100
|
#211
Poor
1.7%
Immigrants | South Eastern Asia
14.7
/100
|
#212
Poor
1.7%
Koreans
14.2
/100
|
#213
Poor
1.7%