Chickasaw vs Immigrants from Peru Doctorate Degree

COMPARE

Chickasaw
Race
Ancestry
AfghanAfricanAlaska NativeAlaskan AthabascanAlbanianAleutAlsatianAmericanApacheArabArapahoArgentineanArmenianAssyrian/Chaldean/SyriacAustralianAustrianBahamianBangladeshiBarbadianBasqueBelgianBelizeanBermudanBhutaneseBlackfeetBolivianBrazilianBritishBritish West IndianBulgarianBurmeseCajunCambodianCanadianCape VerdeanCarpatho RusynCelticCentral AmericanCentral American IndianCherokeeCheyenneChickasawChileanChineseChippewaChoctawColombianColvilleComancheCosta RicanCreeCreekCroatianCrowCubanCypriotCzechCzechoslovakianDanishDelawareDominicanDutchDutch West IndianEastern EuropeanEcuadorianEgyptianEnglishEstonianEthiopianEuropeanFijianFilipinoFinnishFrenchFrench American IndianFrench CanadianGermanGerman RussianGhanaianGreekGuamanian/ChamorroGuatemalanGuyaneseHaitianHmongHonduranHopiHoumaHungarianIcelanderIndian (Asian)IndonesianInupiatIranianIraqiIrishIroquoisIsraeliItalianJamaicanJapaneseJordanianKenyanKiowaKoreanLaotianLatvianLebaneseLiberianLithuanianLumbeeLuxembourgerMacedonianMalaysianMalteseMarshalleseMenomineeMexicanMexican American IndianMongolianMoroccanNative HawaiianNavajoNepaleseNew ZealanderNicaraguanNigerianNorthern EuropeanNorwegianOkinawanOsageOttawaPaiutePakistaniPalestinianPanamanianParaguayanPennsylvania GermanPeruvianPimaPolishPortuguesePotawatomiPuebloPuerto RicanPuget Sound SalishRomanianRussianSalvadoranSamoanScandinavianScotch-IrishScottishSeminoleSenegaleseSerbianShoshoneSierra LeoneanSiouxSlavicSlovakSloveneSomaliSouth AfricanSouth AmericanSouth American IndianSoviet UnionSpaniardSpanishSpanish AmericanSpanish American IndianSri LankanSubsaharan AfricanSudaneseSwedishSwissSyrianTaiwaneseThaiTlingit-HaidaTohono O'OdhamTonganTrinidadian and TobagonianTsimshianTurkishU.S. Virgin IslanderUgandanUkrainianUruguayanUteVenezuelanVietnameseWelshWest IndianYakamaYaquiYugoslavianYumanYup'ikZimbabwean
Immigration
NonimmigrantsImmigrantsAfghanistanAfricaAlbaniaArgentinaArmeniaAsiaAustraliaAustriaBahamasBangladeshBarbadosBelarusBelgiumBelizeBoliviaBosnia and HerzegovinaBrazilBulgariaBurma/MyanmarCabo VerdeCambodiaCameroonCanadaCaribbeanCentral AmericaChileChinaColombiaCongoCosta RicaCroatiaCubaCzechoslovakiaDenmarkDominicaDominican RepublicEastern AfricaEastern AsiaEastern EuropeEcuadorEgyptEl SalvadorEnglandEritreaEthiopiaEuropeFijiFranceGermanyGhanaGreeceGrenadaGuatemalaGuyanaHaitiHondurasHong KongHungaryIndiaIndonesiaIranIraqIrelandIsraelItalyJamaicaJapanJordanKazakhstanKenyaKoreaKuwaitLaosLatin AmericaLatviaLebanonLiberiaLithuaniaMalaysiaMexicoMicronesiaMiddle AfricaMoldovaMoroccoNepalNetherlandsNicaraguaNigeriaNorth AmericaNorth MacedoniaNorthern AfricaNorthern EuropeNorwayOceaniaPakistanPanamaPhilippinesPolandPortugalRomaniaRussiaSaudi ArabiaScotlandSenegalSerbiaSierra LeoneSingaporeSomaliaSouth AfricaSouth AmericaSouth Central AsiaSouth Eastern AsiaSouthern EuropeSpainSri LankaSt. Vincent and the GrenadinesSudanSwedenSwitzerlandSyriaTaiwanThailandTrinidad and TobagoTurkeyUgandaUkraineUruguayUzbekistanVenezuelaVietnamWest IndiesWestern AfricaWestern AsiaWestern EuropeYemenZaireZimbabweAzores
Immigrants from Peru
Race
Ancestry
AfghanAfricanAlaska NativeAlaskan AthabascanAlbanianAleutAlsatianAmericanApacheArabArapahoArgentineanArmenianAssyrian/Chaldean/SyriacAustralianAustrianBahamianBangladeshiBarbadianBasqueBelgianBelizeanBermudanBhutaneseBlackfeetBolivianBrazilianBritishBritish West IndianBulgarianBurmeseCajunCambodianCanadianCape VerdeanCarpatho RusynCelticCentral AmericanCentral American IndianCherokeeCheyenneChileanChineseChippewaChoctawColombianColvilleComancheCosta RicanCreeCreekCroatianCrowCubanCypriotCzechCzechoslovakianDanishDelawareDominicanDutchDutch West IndianEastern EuropeanEcuadorianEgyptianEnglishEstonianEthiopianEuropeanFijianFilipinoFinnishFrenchFrench American IndianFrench CanadianGermanGerman RussianGhanaianGreekGuamanian/ChamorroGuatemalanGuyaneseHaitianHmongHonduranHopiHoumaHungarianIcelanderIndian (Asian)IndonesianInupiatIranianIraqiIrishIroquoisIsraeliItalianJamaicanJapaneseJordanianKenyanKiowaKoreanLaotianLatvianLebaneseLiberianLithuanianLumbeeLuxembourgerMacedonianMalaysianMalteseMarshalleseMenomineeMexicanMexican American IndianMongolianMoroccanNative HawaiianNavajoNepaleseNew ZealanderNicaraguanNigerianNorthern EuropeanNorwegianOkinawanOsageOttawaPaiutePakistaniPalestinianPanamanianParaguayanPennsylvania GermanPeruvianPimaPolishPortuguesePotawatomiPuebloPuerto RicanPuget Sound SalishRomanianRussianSalvadoranSamoanScandinavianScotch-IrishScottishSeminoleSenegaleseSerbianShoshoneSierra LeoneanSiouxSlavicSlovakSloveneSomaliSouth AfricanSouth AmericanSouth American IndianSoviet UnionSpaniardSpanishSpanish AmericanSpanish American IndianSri LankanSubsaharan AfricanSudaneseSwedishSwissSyrianTaiwaneseThaiTlingit-HaidaTohono O'OdhamTonganTrinidadian and TobagonianTsimshianTurkishU.S. Virgin IslanderUgandanUkrainianUruguayanUteVenezuelanVietnameseWelshWest IndianYakamaYaquiYugoslavianYumanYup'ikZimbabwean
Immigration
NonimmigrantsImmigrantsAfghanistanAfricaAlbaniaArgentinaArmeniaAsiaAustraliaAustriaBahamasBangladeshBarbadosBelarusBelgiumBelizeBoliviaBosnia and HerzegovinaBrazilBulgariaBurma/MyanmarCabo VerdeCambodiaCameroonCanadaCaribbeanCentral AmericaChileChinaColombiaCongoCosta RicaCroatiaCubaCzechoslovakiaDenmarkDominicaDominican RepublicEastern AfricaEastern AsiaEastern EuropeEcuadorEgyptEl SalvadorEnglandEritreaEthiopiaEuropeFijiFranceGermanyGhanaGreeceGrenadaGuatemalaGuyanaHaitiHondurasHong KongHungaryIndiaIndonesiaIranIraqIrelandIsraelItalyJamaicaJapanJordanKazakhstanKenyaKoreaKuwaitLaosLatin AmericaLatviaLebanonLiberiaLithuaniaMalaysiaMexicoMicronesiaMiddle AfricaMoldovaMoroccoNepalNetherlandsNicaraguaNigeriaNorth AmericaNorth MacedoniaNorthern AfricaNorthern EuropeNorwayOceaniaPakistanPanamaPeruPhilippinesPolandPortugalRomaniaRussiaSaudi ArabiaScotlandSenegalSerbiaSierra LeoneSingaporeSomaliaSouth AfricaSouth AmericaSouth Central AsiaSouth Eastern AsiaSouthern EuropeSpainSri LankaSt. Vincent and the GrenadinesSudanSwedenSwitzerlandSyriaTaiwanThailandTrinidad and TobagoTurkeyUgandaUkraineUruguayUzbekistanVenezuelaVietnamWest IndiesWestern AfricaWestern AsiaWestern EuropeYemenZaireZimbabweAzores
Doctorate Degree
Income
Poverty
Unemployment
Labor Participation
Family Structure
Vehicle Availability
Education Level
Disability

Doctorate Degree Comparison

Chickasaw

Immigrants from Peru

Tragic
Poor
1.5%
DOCTORATE DEGREE
0.7/ 100
METRIC RATING
262nd/ 347
METRIC RANK
1.7%
DOCTORATE DEGREE
17.6/ 100
METRIC RATING
206th/ 347
METRIC RANK

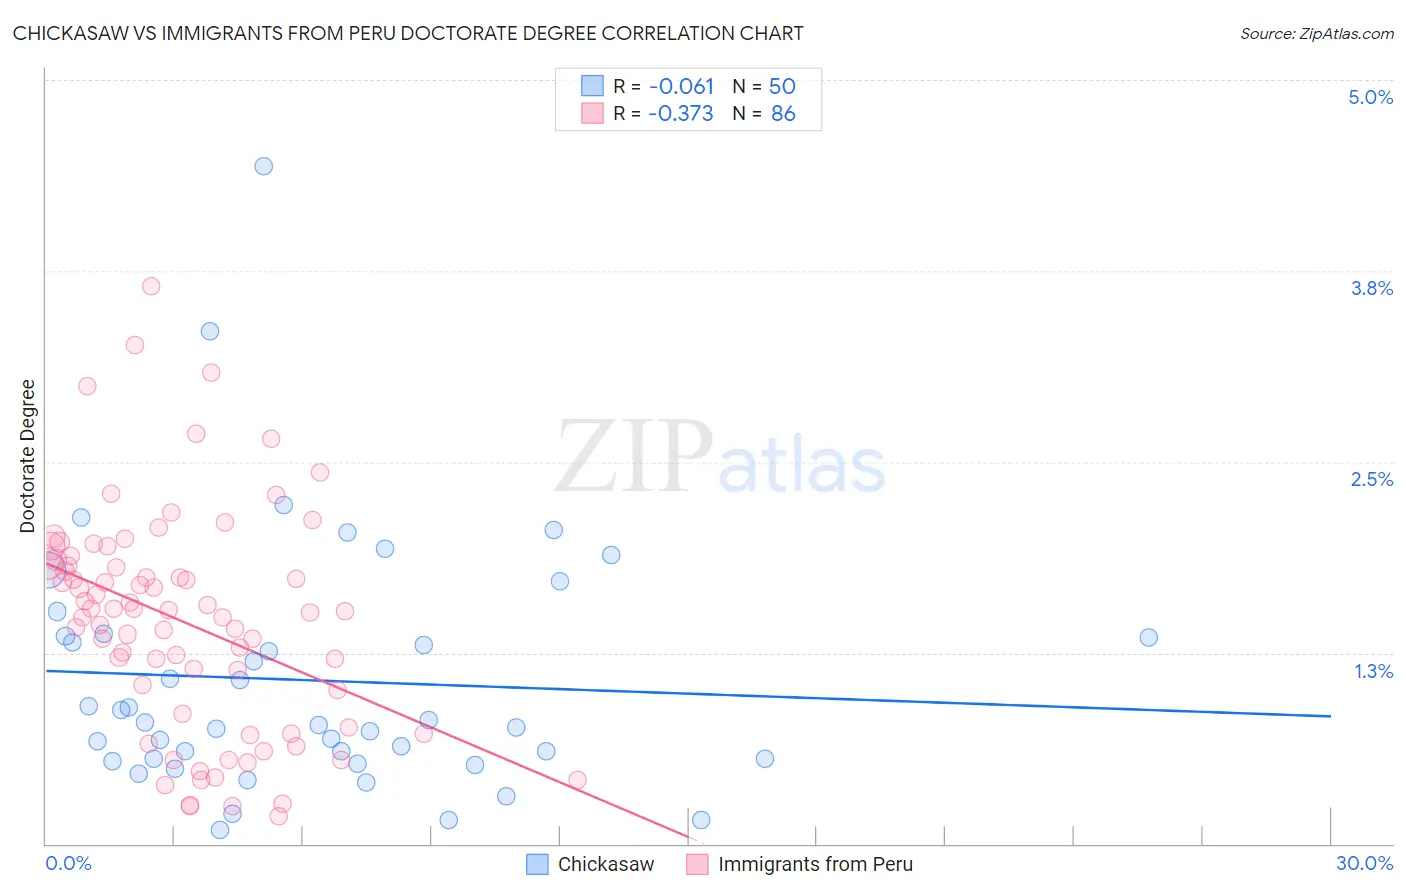
Chickasaw vs Immigrants from Peru Doctorate Degree Correlation Chart

The statistical analysis conducted on geographies consisting of 146,327,093 people shows a slight negative correlation between the proportion of Chickasaw and percentage of population with at least doctorate degree education in the United States with a correlation coefficient (R) of -0.061 and weighted average of 1.5%. Similarly, the statistical analysis conducted on geographies consisting of 327,090,544 people shows a mild negative correlation between the proportion of Immigrants from Peru and percentage of population with at least doctorate degree education in the United States with a correlation coefficient (R) of -0.373 and weighted average of 1.7%, a difference of 14.9%.
Chickasaw vs Immigrants from Peru Doctorate Degree

Doctorate Degree Correlation Summary

MeasurementChickasawImmigrants from Peru
Minimum0.090%0.18%
Maximum4.4%3.6%
Range4.3%3.5%
Mean1.1%1.5%
Median0.79%1.5%
Interquartile 25% (IQ1)0.56%0.85%
Interquartile 75% (IQ3)1.4%1.8%
Interquartile Range (IQR)0.80%0.98%
Standard Deviation (Sample)0.82%0.73%
Standard Deviation (Population)0.81%0.72%

Similar Demographics by Doctorate Degree

Demographics Similar to Chickasaw by Doctorate Degree

In terms of doctorate degree, the demographic groups most similar to Chickasaw are Immigrants from Portugal (1.5%, a difference of 0.15%), Immigrants from Bahamas (1.5%, a difference of 0.17%), Blackfeet (1.5%, a difference of 0.36%), Japanese (1.5%, a difference of 0.61%), and Nicaraguan (1.5%, a difference of 0.64%).
DemographicsRating | RankDoctorate Degree
Trinidadians and Tobagonians
1.0
/100
|
#255
Tragic
1.5%
Central American Indians
1.0
/100
|
#256
Tragic
1.5%
Chippewa
0.9
/100
|
#257
Tragic
1.5%
Immigrants | West Indies
0.9
/100
|
#258
Tragic
1.5%
Liberians
0.9
/100
|
#259
Tragic
1.5%
Japanese
0.9
/100
|
#260
Tragic
1.5%
Immigrants | Portugal
0.8
/100
|
#261
Tragic
1.5%
Chickasaw
0.7
/100
|
#262
Tragic
1.5%
Immigrants | Bahamas
0.7
/100
|
#263
Tragic
1.5%
Blackfeet
0.7
/100
|
#264
Tragic
1.5%
Nicaraguans
0.6
/100
|
#265
Tragic
1.5%
Immigrants | Liberia
0.5
/100
|
#266
Tragic
1.5%
Kiowa
0.5
/100
|
#267
Tragic
1.5%
U.S. Virgin Islanders
0.5
/100
|
#268
Tragic
1.5%
Crow
0.5
/100
|
#269
Tragic
1.5%

Demographics Similar to Immigrants from Peru by Doctorate Degree

In terms of doctorate degree, the demographic groups most similar to Immigrants from Peru are Yugoslavian (1.7%, a difference of 0.16%), Colombian (1.7%, a difference of 0.44%), Venezuelan (1.7%, a difference of 0.48%), Immigrants from Western Africa (1.7%, a difference of 0.63%), and Tongan (1.7%, a difference of 0.71%).
DemographicsRating | RankDoctorate Degree
Immigrants | South America
23.3
/100
|
#199
Fair
1.8%
Whites/Caucasians
22.8
/100
|
#200
Fair
1.8%
Immigrants | Nigeria
22.4
/100
|
#201
Fair
1.8%
Portuguese
21.4
/100
|
#202
Fair
1.8%
Immigrants | Vietnam
21.4
/100
|
#203
Fair
1.8%
Somalis
21.2
/100
|
#204
Fair
1.7%
Venezuelans
19.5
/100
|
#205
Poor
1.7%
Immigrants | Peru
17.6
/100
|
#206
Poor
1.7%
Yugoslavians
17.1
/100
|
#207
Poor
1.7%
Colombians
16.1
/100
|
#208
Poor
1.7%
Immigrants | Western Africa
15.4
/100
|
#209
Poor
1.7%
Tongans
15.1
/100
|
#210
Poor
1.7%
Immigrants | Armenia
15.1
/100
|
#211
Poor
1.7%
Immigrants | South Eastern Asia
14.7
/100
|
#212
Poor
1.7%
Koreans
14.2
/100
|
#213
Poor
1.7%