Chippewa vs New Zealander College, Under 1 year
COMPARE
Chippewa
New Zealander
College, Under 1 year
College, Under 1 year Comparison
Chippewa
New Zealanders
62.6%
COLLEGE, UNDER 1 YEAR
2.0/ 100
METRIC RATING
234th/ 347
METRIC RANK
70.2%
COLLEGE, UNDER 1 YEAR
99.9/ 100
METRIC RATING
44th/ 347
METRIC RANK
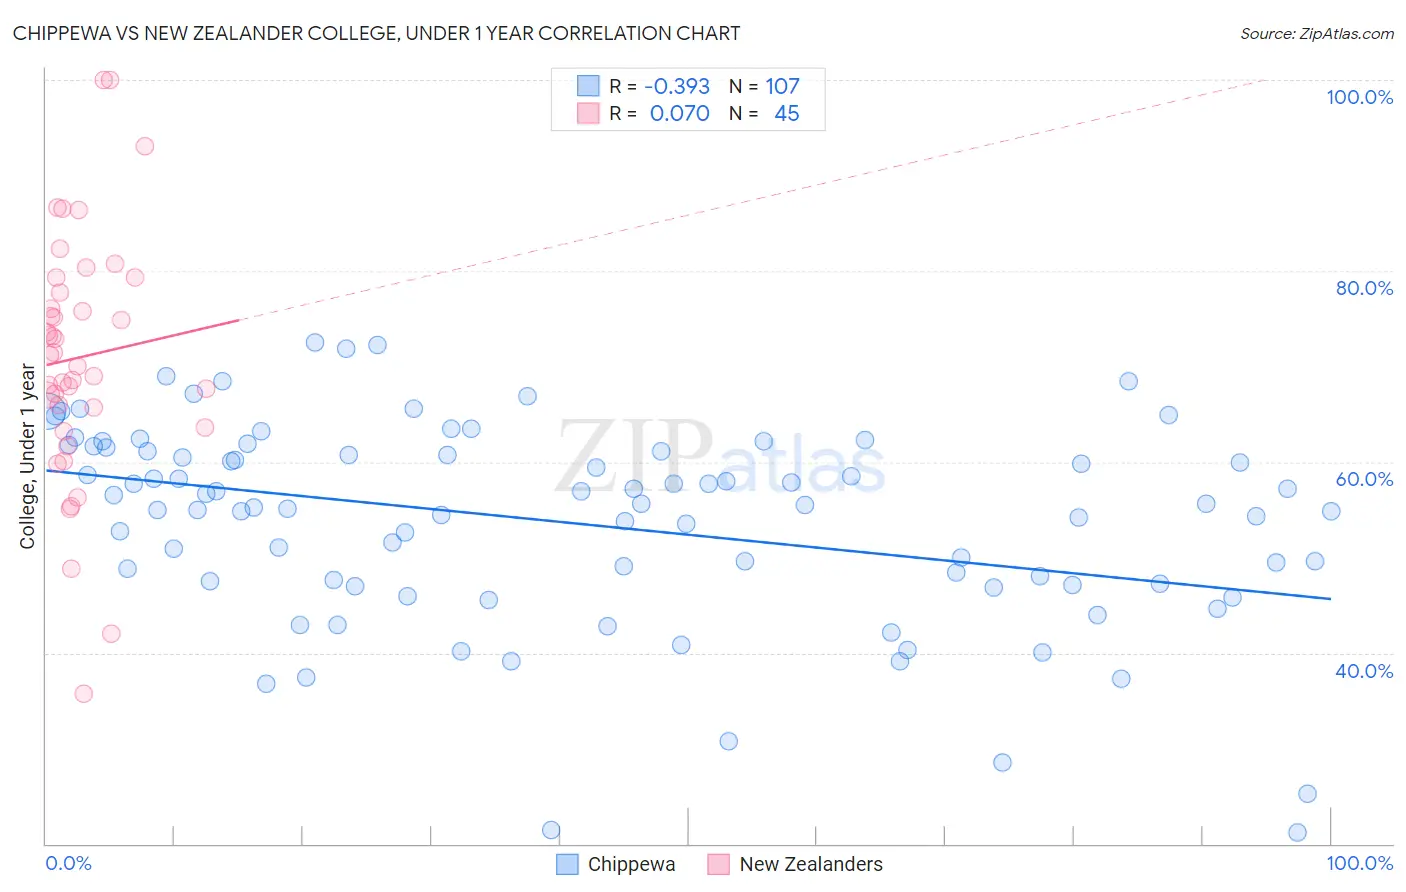
Chippewa vs New Zealander College, Under 1 year Correlation Chart
The statistical analysis conducted on geographies consisting of 215,068,018 people shows a mild negative correlation between the proportion of Chippewa and percentage of population with at least college, under 1 year education in the United States with a correlation coefficient (R) of -0.393 and weighted average of 62.6%. Similarly, the statistical analysis conducted on geographies consisting of 106,918,889 people shows a slight positive correlation between the proportion of New Zealanders and percentage of population with at least college, under 1 year education in the United States with a correlation coefficient (R) of 0.070 and weighted average of 70.2%, a difference of 12.2%.
College, Under 1 year Correlation Summary
| Measurement | Chippewa | New Zealander |
| Minimum | 21.2% | 35.8% |
| Maximum | 72.5% | 100.0% |
| Range | 51.3% | 64.2% |
| Mean | 53.6% | 70.9% |
| Median | 55.5% | 71.2% |
| Interquartile 25% (IQ1) | 47.2% | 64.6% |
| Interquartile 75% (IQ3) | 61.1% | 78.5% |
| Interquartile Range (IQR) | 14.0% | 13.9% |
| Standard Deviation (Sample) | 10.5% | 12.9% |
| Standard Deviation (Population) | 10.5% | 12.8% |
Similar Demographics by College, Under 1 year
Demographics Similar to Chippewa by College, Under 1 year
In terms of college, under 1 year, the demographic groups most similar to Chippewa are Iroquois (62.6%, a difference of 0.030%), Spanish American (62.6%, a difference of 0.050%), Osage (62.7%, a difference of 0.15%), Immigrants (62.5%, a difference of 0.18%), and Immigrants from Burma/Myanmar (62.5%, a difference of 0.21%).
| Demographics | Rating | Rank | College, Under 1 year |
| Immigrants | Ghana | 3.7 /100 | #227 | Tragic 63.1% |
| Samoans | 3.3 /100 | #228 | Tragic 63.0% |
| Liberians | 3.2 /100 | #229 | Tragic 63.0% |
| Immigrants | Nonimmigrants | 3.0 /100 | #230 | Tragic 62.9% |
| Immigrants | Western Africa | 2.4 /100 | #231 | Tragic 62.8% |
| Osage | 2.2 /100 | #232 | Tragic 62.7% |
| Iroquois | 2.0 /100 | #233 | Tragic 62.6% |
| Chippewa | 2.0 /100 | #234 | Tragic 62.6% |
| Spanish Americans | 1.9 /100 | #235 | Tragic 62.6% |
| Immigrants | Immigrants | 1.7 /100 | #236 | Tragic 62.5% |
| Immigrants | Burma/Myanmar | 1.6 /100 | #237 | Tragic 62.5% |
| French American Indians | 1.5 /100 | #238 | Tragic 62.4% |
| Nepalese | 1.1 /100 | #239 | Tragic 62.2% |
| Aleuts | 1.1 /100 | #240 | Tragic 62.2% |
| Ottawa | 1.1 /100 | #241 | Tragic 62.2% |
Demographics Similar to New Zealanders by College, Under 1 year
In terms of college, under 1 year, the demographic groups most similar to New Zealanders are Israeli (70.2%, a difference of 0.0%), Immigrants from Norway (70.2%, a difference of 0.020%), Immigrants from Lithuania (70.3%, a difference of 0.070%), Immigrants from Kuwait (70.3%, a difference of 0.12%), and Immigrants from Latvia (70.1%, a difference of 0.14%).
| Demographics | Rating | Rank | College, Under 1 year |
| Immigrants | Saudi Arabia | 99.9 /100 | #37 | Exceptional 70.4% |
| Australians | 99.9 /100 | #38 | Exceptional 70.4% |
| Bhutanese | 99.9 /100 | #39 | Exceptional 70.3% |
| Immigrants | Turkey | 99.9 /100 | #40 | Exceptional 70.3% |
| Immigrants | Kuwait | 99.9 /100 | #41 | Exceptional 70.3% |
| Immigrants | Lithuania | 99.9 /100 | #42 | Exceptional 70.3% |
| Israelis | 99.9 /100 | #43 | Exceptional 70.2% |
| New Zealanders | 99.9 /100 | #44 | Exceptional 70.2% |
| Immigrants | Norway | 99.9 /100 | #45 | Exceptional 70.2% |
| Immigrants | Latvia | 99.9 /100 | #46 | Exceptional 70.1% |
| Immigrants | Bulgaria | 99.8 /100 | #47 | Exceptional 70.0% |
| Immigrants | Netherlands | 99.8 /100 | #48 | Exceptional 70.0% |
| Immigrants | Austria | 99.8 /100 | #49 | Exceptional 70.0% |
| Zimbabweans | 99.8 /100 | #50 | Exceptional 69.9% |
| Mongolians | 99.8 /100 | #51 | Exceptional 69.9% |