Chippewa vs Immigrants from Chile 9th Grade

COMPARE

Chippewa
Race
Ancestry
AfghanAfricanAlaska NativeAlaskan AthabascanAlbanianAleutAlsatianAmericanApacheArabArapahoArgentineanArmenianAssyrian/Chaldean/SyriacAustralianAustrianBahamianBangladeshiBarbadianBasqueBelgianBelizeanBermudanBhutaneseBlackfeetBolivianBrazilianBritishBritish West IndianBulgarianBurmeseCajunCambodianCanadianCape VerdeanCarpatho RusynCelticCentral AmericanCentral American IndianCherokeeCheyenneChickasawChileanChineseChippewaChoctawColombianColvilleComancheCosta RicanCreeCreekCroatianCrowCubanCypriotCzechCzechoslovakianDanishDelawareDominicanDutchDutch West IndianEastern EuropeanEcuadorianEgyptianEnglishEstonianEthiopianEuropeanFijianFilipinoFinnishFrenchFrench American IndianFrench CanadianGermanGerman RussianGhanaianGreekGuamanian/ChamorroGuatemalanGuyaneseHaitianHmongHonduranHopiHoumaHungarianIcelanderIndian (Asian)IndonesianInupiatIranianIraqiIrishIroquoisIsraeliItalianJamaicanJapaneseJordanianKenyanKiowaKoreanLaotianLatvianLebaneseLiberianLithuanianLumbeeLuxembourgerMacedonianMalaysianMalteseMarshalleseMenomineeMexicanMexican American IndianMongolianMoroccanNative HawaiianNavajoNepaleseNew ZealanderNicaraguanNigerianNorthern EuropeanNorwegianOkinawanOsageOttawaPaiutePakistaniPalestinianPanamanianParaguayanPennsylvania GermanPeruvianPimaPolishPortuguesePotawatomiPuebloPuerto RicanPuget Sound SalishRomanianRussianSalvadoranSamoanScandinavianScotch-IrishScottishSeminoleSenegaleseSerbianShoshoneSierra LeoneanSiouxSlavicSlovakSloveneSomaliSouth AfricanSouth AmericanSouth American IndianSoviet UnionSpaniardSpanishSpanish AmericanSpanish American IndianSri LankanSubsaharan AfricanSudaneseSwedishSwissSyrianTaiwaneseThaiTlingit-HaidaTohono O'OdhamTonganTrinidadian and TobagonianTsimshianTurkishU.S. Virgin IslanderUgandanUkrainianUruguayanUteVenezuelanVietnameseWelshWest IndianYakamaYaquiYugoslavianYumanYup'ikZimbabwean
Immigration
NonimmigrantsImmigrantsAfghanistanAfricaAlbaniaArgentinaArmeniaAsiaAustraliaAustriaBahamasBangladeshBarbadosBelarusBelgiumBelizeBoliviaBosnia and HerzegovinaBrazilBulgariaBurma/MyanmarCabo VerdeCambodiaCameroonCanadaCaribbeanCentral AmericaChinaColombiaCongoCosta RicaCroatiaCubaCzechoslovakiaDenmarkDominicaDominican RepublicEastern AfricaEastern AsiaEastern EuropeEcuadorEgyptEl SalvadorEnglandEritreaEthiopiaEuropeFijiFranceGermanyGhanaGreeceGrenadaGuatemalaGuyanaHaitiHondurasHong KongHungaryIndiaIndonesiaIranIraqIrelandIsraelItalyJamaicaJapanJordanKazakhstanKenyaKoreaKuwaitLaosLatin AmericaLatviaLebanonLiberiaLithuaniaMalaysiaMexicoMicronesiaMiddle AfricaMoldovaMoroccoNepalNetherlandsNicaraguaNigeriaNorth AmericaNorth MacedoniaNorthern AfricaNorthern EuropeNorwayOceaniaPakistanPanamaPeruPhilippinesPolandPortugalRomaniaRussiaSaudi ArabiaScotlandSenegalSerbiaSierra LeoneSingaporeSomaliaSouth AfricaSouth AmericaSouth Central AsiaSouth Eastern AsiaSouthern EuropeSpainSri LankaSt. Vincent and the GrenadinesSudanSwedenSwitzerlandSyriaTaiwanThailandTrinidad and TobagoTurkeyUgandaUkraineUruguayUzbekistanVenezuelaVietnamWest IndiesWestern AfricaWestern AsiaWestern EuropeYemenZaireZimbabweAzores
Immigrants from Chile
Race
Ancestry
AfghanAfricanAlaska NativeAlaskan AthabascanAlbanianAleutAlsatianAmericanApacheArabArapahoArgentineanArmenianAssyrian/Chaldean/SyriacAustralianAustrianBahamianBangladeshiBarbadianBasqueBelgianBelizeanBermudanBhutaneseBlackfeetBolivianBrazilianBritishBritish West IndianBulgarianBurmeseCajunCambodianCanadianCape VerdeanCarpatho RusynCelticCentral AmericanCentral American IndianCherokeeCheyenneChickasawChileanChineseChoctawColombianColvilleComancheCosta RicanCreeCreekCroatianCrowCubanCypriotCzechCzechoslovakianDanishDelawareDominicanDutchDutch West IndianEastern EuropeanEcuadorianEgyptianEnglishEstonianEthiopianEuropeanFijianFilipinoFinnishFrenchFrench American IndianFrench CanadianGermanGerman RussianGhanaianGreekGuamanian/ChamorroGuatemalanGuyaneseHaitianHmongHonduranHopiHoumaHungarianIcelanderIndian (Asian)IndonesianInupiatIranianIraqiIrishIroquoisIsraeliItalianJamaicanJapaneseJordanianKenyanKiowaKoreanLaotianLatvianLebaneseLiberianLithuanianLumbeeLuxembourgerMacedonianMalaysianMalteseMarshalleseMenomineeMexicanMexican American IndianMongolianMoroccanNative HawaiianNavajoNepaleseNew ZealanderNicaraguanNigerianNorthern EuropeanNorwegianOkinawanOsageOttawaPaiutePakistaniPalestinianPanamanianParaguayanPennsylvania GermanPeruvianPimaPolishPortuguesePotawatomiPuebloPuerto RicanPuget Sound SalishRomanianRussianSalvadoranSamoanScandinavianScotch-IrishScottishSeminoleSenegaleseSerbianShoshoneSierra LeoneanSiouxSlavicSlovakSloveneSomaliSouth AfricanSouth AmericanSouth American IndianSoviet UnionSpaniardSpanishSpanish AmericanSpanish American IndianSri LankanSubsaharan AfricanSudaneseSwedishSwissSyrianTaiwaneseThaiTlingit-HaidaTohono O'OdhamTonganTrinidadian and TobagonianTsimshianTurkishU.S. Virgin IslanderUgandanUkrainianUruguayanUteVenezuelanVietnameseWelshWest IndianYakamaYaquiYugoslavianYumanYup'ikZimbabwean
Immigration
NonimmigrantsImmigrantsAfghanistanAfricaAlbaniaArgentinaArmeniaAsiaAustraliaAustriaBahamasBangladeshBarbadosBelarusBelgiumBelizeBoliviaBosnia and HerzegovinaBrazilBulgariaBurma/MyanmarCabo VerdeCambodiaCameroonCanadaCaribbeanCentral AmericaChileChinaColombiaCongoCosta RicaCroatiaCubaCzechoslovakiaDenmarkDominicaDominican RepublicEastern AfricaEastern AsiaEastern EuropeEcuadorEgyptEl SalvadorEnglandEritreaEthiopiaEuropeFijiFranceGermanyGhanaGreeceGrenadaGuatemalaGuyanaHaitiHondurasHong KongHungaryIndiaIndonesiaIranIraqIrelandIsraelItalyJamaicaJapanJordanKazakhstanKenyaKoreaKuwaitLaosLatin AmericaLatviaLebanonLiberiaLithuaniaMalaysiaMexicoMicronesiaMiddle AfricaMoldovaMoroccoNepalNetherlandsNicaraguaNigeriaNorth AmericaNorth MacedoniaNorthern AfricaNorthern EuropeNorwayOceaniaPakistanPanamaPeruPhilippinesPolandPortugalRomaniaRussiaSaudi ArabiaScotlandSenegalSerbiaSierra LeoneSingaporeSomaliaSouth AfricaSouth AmericaSouth Central AsiaSouth Eastern AsiaSouthern EuropeSpainSri LankaSt. Vincent and the GrenadinesSudanSwedenSwitzerlandSyriaTaiwanThailandTrinidad and TobagoTurkeyUgandaUkraineUruguayUzbekistanVenezuelaVietnamWest IndiesWestern AfricaWestern AsiaWestern EuropeYemenZaireZimbabweAzores
9th Grade
Income
Poverty
Unemployment
Labor Participation
Family Structure
Vehicle Availability
Education Level
Disability

9th Grade Comparison

Chippewa

Immigrants from Chile

Exceptional
Poor
96.1%
9TH GRADE
99.9/ 100
METRIC RATING
42nd/ 347
METRIC RANK
94.5%
9TH GRADE
13.4/ 100
METRIC RATING
210th/ 347
METRIC RANK

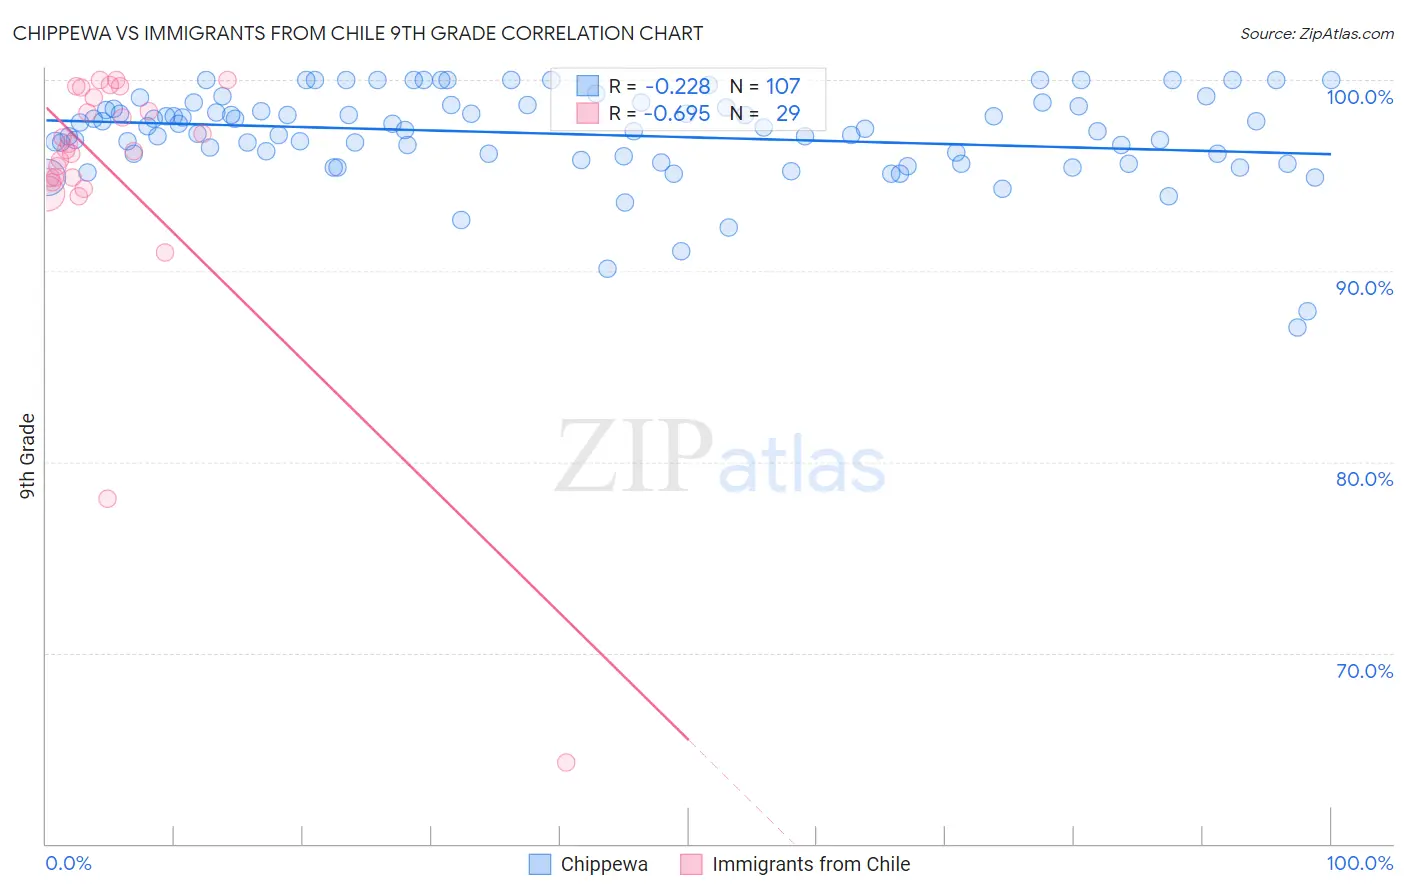
Chippewa vs Immigrants from Chile 9th Grade Correlation Chart

The statistical analysis conducted on geographies consisting of 215,065,864 people shows a weak negative correlation between the proportion of Chippewa and percentage of population with at least 9th grade education in the United States with a correlation coefficient (R) of -0.228 and weighted average of 96.1%. Similarly, the statistical analysis conducted on geographies consisting of 218,647,266 people shows a significant negative correlation between the proportion of Immigrants from Chile and percentage of population with at least 9th grade education in the United States with a correlation coefficient (R) of -0.695 and weighted average of 94.5%, a difference of 1.6%.
Chippewa vs Immigrants from Chile 9th Grade

9th Grade Correlation Summary

MeasurementChippewaImmigrants from Chile
Minimum87.1%64.3%
Maximum100.0%100.0%
Range12.9%35.7%
Mean97.2%95.1%
Median97.5%96.3%
Interquartile 25% (IQ1)96.0%94.8%
Interquartile 75% (IQ3)98.7%99.4%
Interquartile Range (IQR)2.7%4.6%
Standard Deviation (Sample)2.4%7.3%
Standard Deviation (Population)2.4%7.1%

Similar Demographics by 9th Grade

Demographics Similar to Chippewa by 9th Grade

In terms of 9th grade, the demographic groups most similar to Chippewa are Czechoslovakian (96.1%, a difference of 0.0%), Slavic (96.1%, a difference of 0.010%), Iranian (96.1%, a difference of 0.010%), Ottawa (96.1%, a difference of 0.030%), and Alaska Native (96.1%, a difference of 0.030%).
DemographicsRating | Rank9th Grade
Bulgarians
99.9
/100
|
#35
Exceptional
96.2%
Northern Europeans
99.9
/100
|
#36
Exceptional
96.2%
Estonians
99.9
/100
|
#37
Exceptional
96.1%
Immigrants | Scotland
99.9
/100
|
#38
Exceptional
96.1%
Ottawa
99.9
/100
|
#39
Exceptional
96.1%
Slavs
99.9
/100
|
#40
Exceptional
96.1%
Czechoslovakians
99.9
/100
|
#41
Exceptional
96.1%
Chippewa
99.9
/100
|
#42
Exceptional
96.1%
Iranians
99.9
/100
|
#43
Exceptional
96.1%
Alaska Natives
99.9
/100
|
#44
Exceptional
96.1%
Crow
99.9
/100
|
#45
Exceptional
96.1%
Immigrants | India
99.9
/100
|
#46
Exceptional
96.1%
Russians
99.9
/100
|
#47
Exceptional
96.0%
Australians
99.9
/100
|
#48
Exceptional
96.0%
Greeks
99.9
/100
|
#49
Exceptional
96.0%

Demographics Similar to Immigrants from Chile by 9th Grade

In terms of 9th grade, the demographic groups most similar to Immigrants from Chile are Comanche (94.6%, a difference of 0.020%), Immigrants from Indonesia (94.5%, a difference of 0.020%), Immigrants from Malaysia (94.5%, a difference of 0.020%), Immigrants from Oceania (94.5%, a difference of 0.020%), and Immigrants from Pakistan (94.6%, a difference of 0.030%).
DemographicsRating | Rank9th Grade
Immigrants | Bahamas
19.8
/100
|
#203
Poor
94.6%
Moroccans
19.6
/100
|
#204
Poor
94.6%
Immigrants | Sudan
17.6
/100
|
#205
Poor
94.6%
Samoans
17.3
/100
|
#206
Poor
94.6%
Immigrants | Morocco
16.3
/100
|
#207
Poor
94.6%
Immigrants | Pakistan
15.5
/100
|
#208
Poor
94.6%
Comanche
14.9
/100
|
#209
Poor
94.6%
Immigrants | Chile
13.4
/100
|
#210
Poor
94.5%
Immigrants | Indonesia
12.3
/100
|
#211
Poor
94.5%
Immigrants | Malaysia
12.2
/100
|
#212
Poor
94.5%
Immigrants | Oceania
12.1
/100
|
#213
Poor
94.5%
Immigrants | Liberia
11.8
/100
|
#214
Poor
94.5%
Immigrants | Syria
11.0
/100
|
#215
Poor
94.5%
Immigrants | Western Asia
10.7
/100
|
#216
Poor
94.5%
Asians
9.9
/100
|
#217
Tragic
94.5%