Chippewa vs Mexican American Indian 9th Grade
COMPARE
Chippewa
Mexican American Indian
9th Grade
9th Grade Comparison
Chippewa
Mexican American Indians
96.1%
9TH GRADE
99.9/ 100
METRIC RATING
42nd/ 347
METRIC RANK
90.9%
9TH GRADE
0.0/ 100
METRIC RATING
331st/ 347
METRIC RANK
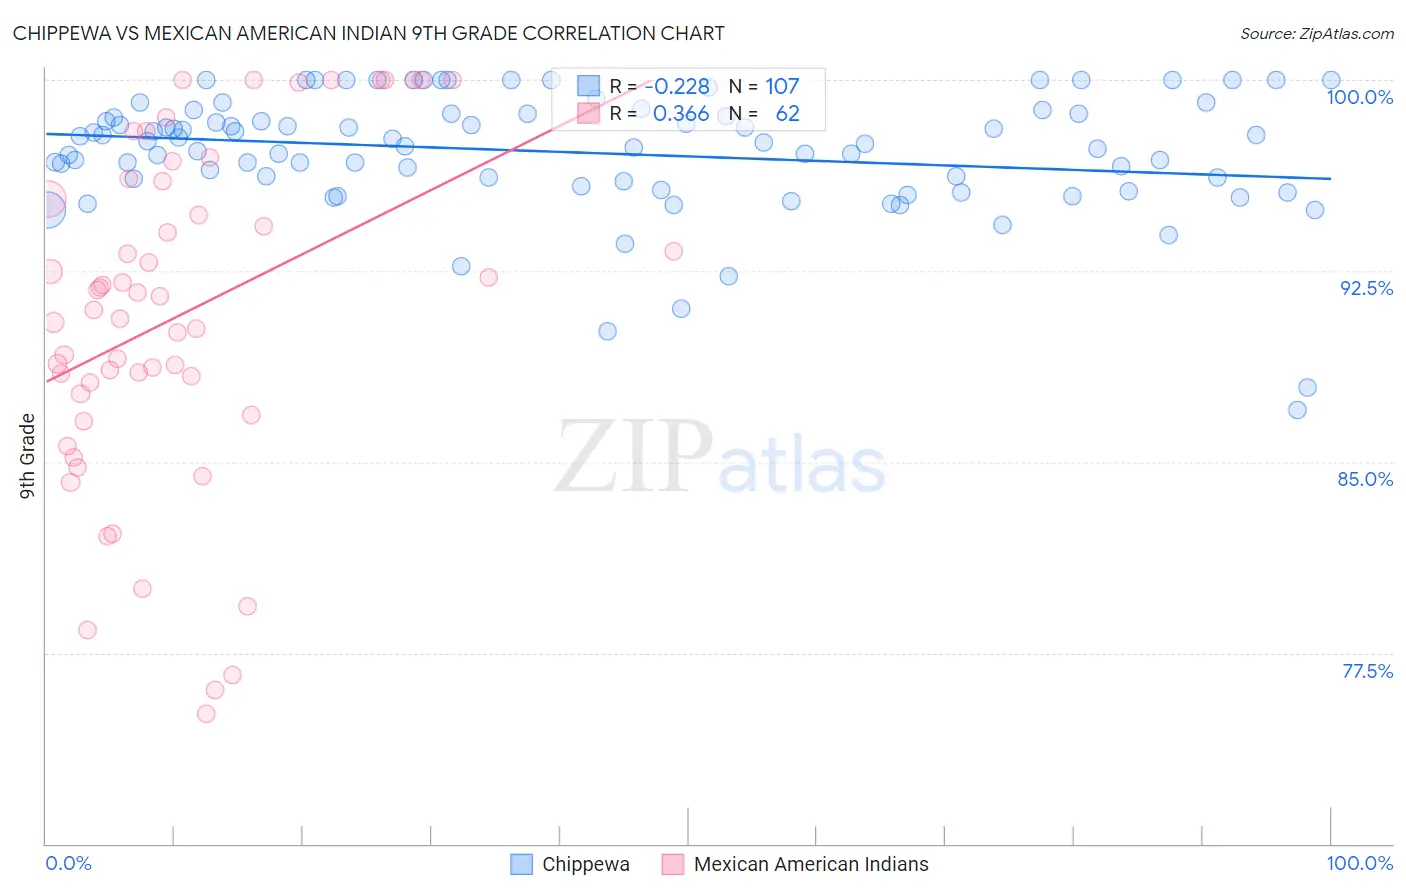
Chippewa vs Mexican American Indian 9th Grade Correlation Chart
The statistical analysis conducted on geographies consisting of 215,065,864 people shows a weak negative correlation between the proportion of Chippewa and percentage of population with at least 9th grade education in the United States with a correlation coefficient (R) of -0.228 and weighted average of 96.1%. Similarly, the statistical analysis conducted on geographies consisting of 317,621,104 people shows a mild positive correlation between the proportion of Mexican American Indians and percentage of population with at least 9th grade education in the United States with a correlation coefficient (R) of 0.366 and weighted average of 90.9%, a difference of 5.7%.
9th Grade Correlation Summary
| Measurement | Chippewa | Mexican American Indian |
| Minimum | 87.1% | 75.1% |
| Maximum | 100.0% | 100.0% |
| Range | 12.9% | 24.9% |
| Mean | 97.2% | 90.8% |
| Median | 97.5% | 91.2% |
| Interquartile 25% (IQ1) | 96.0% | 87.7% |
| Interquartile 75% (IQ3) | 98.7% | 96.0% |
| Interquartile Range (IQR) | 2.7% | 8.3% |
| Standard Deviation (Sample) | 2.4% | 6.6% |
| Standard Deviation (Population) | 2.4% | 6.5% |
Similar Demographics by 9th Grade
Demographics Similar to Chippewa by 9th Grade
In terms of 9th grade, the demographic groups most similar to Chippewa are Czechoslovakian (96.1%, a difference of 0.0%), Slavic (96.1%, a difference of 0.010%), Iranian (96.1%, a difference of 0.010%), Ottawa (96.1%, a difference of 0.030%), and Alaska Native (96.1%, a difference of 0.030%).
| Demographics | Rating | Rank | 9th Grade |
| Bulgarians | 99.9 /100 | #35 | Exceptional 96.2% |
| Northern Europeans | 99.9 /100 | #36 | Exceptional 96.2% |
| Estonians | 99.9 /100 | #37 | Exceptional 96.1% |
| Immigrants | Scotland | 99.9 /100 | #38 | Exceptional 96.1% |
| Ottawa | 99.9 /100 | #39 | Exceptional 96.1% |
| Slavs | 99.9 /100 | #40 | Exceptional 96.1% |
| Czechoslovakians | 99.9 /100 | #41 | Exceptional 96.1% |
| Chippewa | 99.9 /100 | #42 | Exceptional 96.1% |
| Iranians | 99.9 /100 | #43 | Exceptional 96.1% |
| Alaska Natives | 99.9 /100 | #44 | Exceptional 96.1% |
| Crow | 99.9 /100 | #45 | Exceptional 96.1% |
| Immigrants | India | 99.9 /100 | #46 | Exceptional 96.1% |
| Russians | 99.9 /100 | #47 | Exceptional 96.0% |
| Australians | 99.9 /100 | #48 | Exceptional 96.0% |
| Greeks | 99.9 /100 | #49 | Exceptional 96.0% |
Demographics Similar to Mexican American Indians by 9th Grade
In terms of 9th grade, the demographic groups most similar to Mexican American Indians are Hispanic or Latino (90.9%, a difference of 0.020%), Immigrants from Cabo Verde (90.9%, a difference of 0.030%), Immigrants from Yemen (90.8%, a difference of 0.11%), Honduran (91.0%, a difference of 0.15%), and Immigrants from the Azores (90.8%, a difference of 0.16%).
| Demographics | Rating | Rank | 9th Grade |
| Immigrants | Belize | 0.0 /100 | #324 | Tragic 91.8% |
| Central American Indians | 0.0 /100 | #325 | Tragic 91.5% |
| Immigrants | Armenia | 0.0 /100 | #326 | Tragic 91.4% |
| Immigrants | Nicaragua | 0.0 /100 | #327 | Tragic 91.3% |
| Dominicans | 0.0 /100 | #328 | Tragic 91.1% |
| Hondurans | 0.0 /100 | #329 | Tragic 91.0% |
| Immigrants | Cabo Verde | 0.0 /100 | #330 | Tragic 90.9% |
| Mexican American Indians | 0.0 /100 | #331 | Tragic 90.9% |
| Hispanics or Latinos | 0.0 /100 | #332 | Tragic 90.9% |
| Immigrants | Yemen | 0.0 /100 | #333 | Tragic 90.8% |
| Immigrants | Azores | 0.0 /100 | #334 | Tragic 90.8% |
| Immigrants | Honduras | 0.0 /100 | #335 | Tragic 90.6% |
| Immigrants | Dominican Republic | 0.0 /100 | #336 | Tragic 90.5% |
| Immigrants | Latin America | 0.0 /100 | #337 | Tragic 90.4% |
| Central Americans | 0.0 /100 | #338 | Tragic 90.4% |