Chickasaw vs Hawaiian Doctorate Degree
COMPARE
Chickasaw
Hawaiian
Doctorate Degree
Doctorate Degree Comparison
Chickasaw
Hawaiians
1.5%
DOCTORATE DEGREE
0.7/ 100
METRIC RATING
262nd/ 347
METRIC RANK
1.5%
DOCTORATE DEGREE
0.4/ 100
METRIC RATING
278th/ 347
METRIC RANK
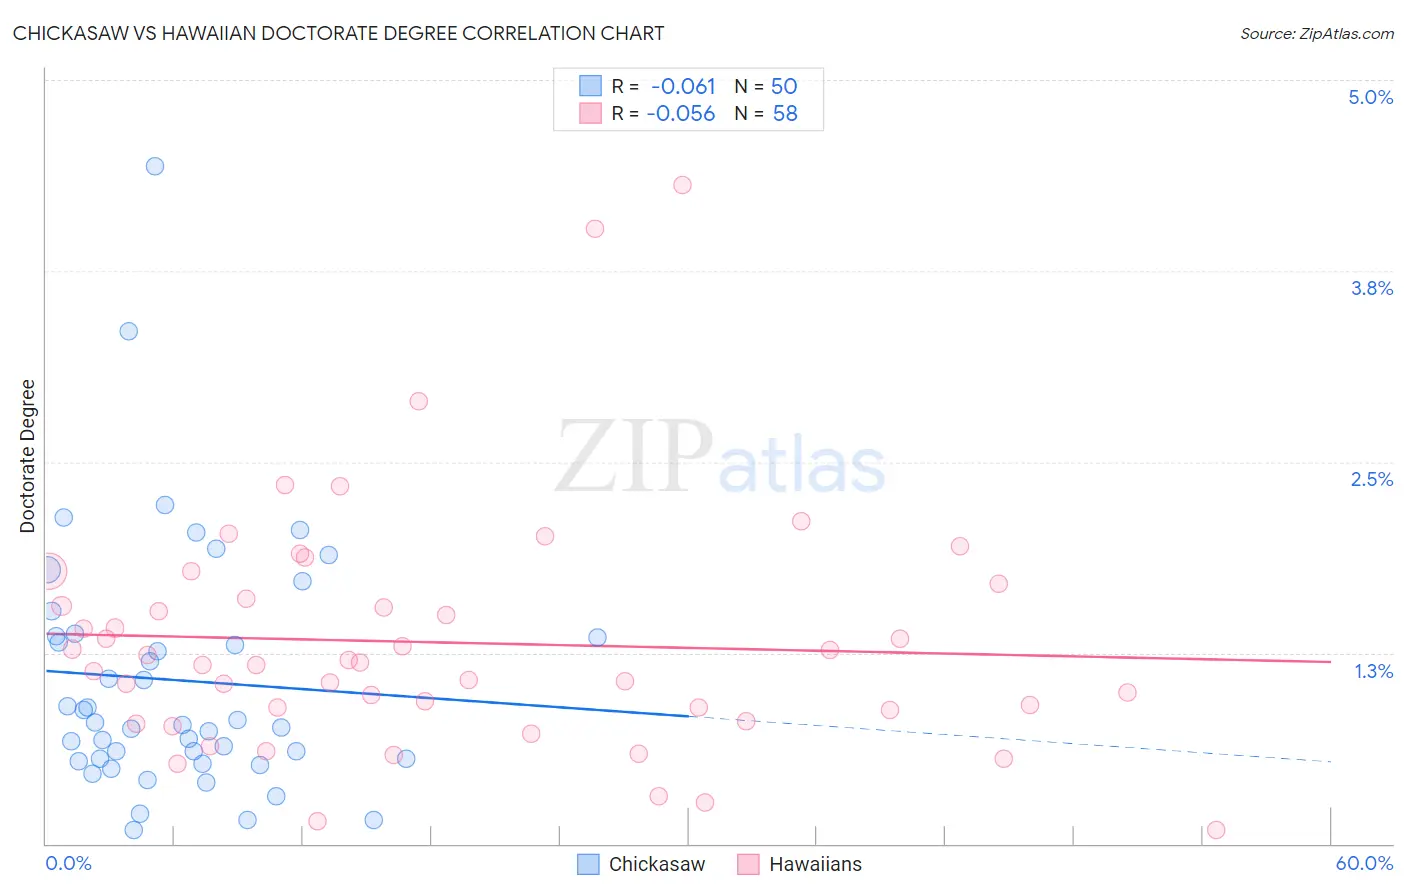
Chickasaw vs Hawaiian Doctorate Degree Correlation Chart
The statistical analysis conducted on geographies consisting of 146,327,093 people shows a slight negative correlation between the proportion of Chickasaw and percentage of population with at least doctorate degree education in the United States with a correlation coefficient (R) of -0.061 and weighted average of 1.5%. Similarly, the statistical analysis conducted on geographies consisting of 323,773,151 people shows a slight negative correlation between the proportion of Hawaiians and percentage of population with at least doctorate degree education in the United States with a correlation coefficient (R) of -0.056 and weighted average of 1.5%, a difference of 3.2%.
Doctorate Degree Correlation Summary
| Measurement | Chickasaw | Hawaiian |
| Minimum | 0.090% | 0.092% |
| Maximum | 4.4% | 4.3% |
| Range | 4.3% | 4.2% |
| Mean | 1.1% | 1.3% |
| Median | 0.79% | 1.2% |
| Interquartile 25% (IQ1) | 0.56% | 0.88% |
| Interquartile 75% (IQ3) | 1.4% | 1.6% |
| Interquartile Range (IQR) | 0.80% | 0.73% |
| Standard Deviation (Sample) | 0.82% | 0.79% |
| Standard Deviation (Population) | 0.81% | 0.78% |
Demographics Similar to Chickasaw and Hawaiians by Doctorate Degree
In terms of doctorate degree, the demographic groups most similar to Chickasaw are Immigrants from Portugal (1.5%, a difference of 0.15%), Immigrants from Bahamas (1.5%, a difference of 0.17%), Blackfeet (1.5%, a difference of 0.36%), Japanese (1.5%, a difference of 0.61%), and Nicaraguan (1.5%, a difference of 0.64%). Similarly, the demographic groups most similar to Hawaiians are Bahamian (1.5%, a difference of 0.060%), Marshallese (1.5%, a difference of 0.22%), Ecuadorian (1.5%, a difference of 0.23%), Paiute (1.5%, a difference of 0.53%), and Aleut (1.5%, a difference of 0.59%).
| Demographics | Rating | Rank | Doctorate Degree |
| Japanese | 0.9 /100 | #260 | Tragic 1.5% |
| Immigrants | Portugal | 0.8 /100 | #261 | Tragic 1.5% |
| Chickasaw | 0.7 /100 | #262 | Tragic 1.5% |
| Immigrants | Bahamas | 0.7 /100 | #263 | Tragic 1.5% |
| Blackfeet | 0.7 /100 | #264 | Tragic 1.5% |
| Nicaraguans | 0.6 /100 | #265 | Tragic 1.5% |
| Immigrants | Liberia | 0.5 /100 | #266 | Tragic 1.5% |
| Kiowa | 0.5 /100 | #267 | Tragic 1.5% |
| U.S. Virgin Islanders | 0.5 /100 | #268 | Tragic 1.5% |
| Crow | 0.5 /100 | #269 | Tragic 1.5% |
| Salvadorans | 0.5 /100 | #270 | Tragic 1.5% |
| Immigrants | Trinidad and Tobago | 0.5 /100 | #271 | Tragic 1.5% |
| Immigrants | Barbados | 0.4 /100 | #272 | Tragic 1.5% |
| Sioux | 0.4 /100 | #273 | Tragic 1.5% |
| Yaqui | 0.4 /100 | #274 | Tragic 1.5% |
| Aleuts | 0.4 /100 | #275 | Tragic 1.5% |
| Paiute | 0.4 /100 | #276 | Tragic 1.5% |
| Bahamians | 0.4 /100 | #277 | Tragic 1.5% |
| Hawaiians | 0.4 /100 | #278 | Tragic 1.5% |
| Marshallese | 0.4 /100 | #279 | Tragic 1.5% |
| Ecuadorians | 0.4 /100 | #280 | Tragic 1.5% |