Afghan vs Immigrants from Poland College, Under 1 year

COMPARE

Afghan
Race
Ancestry
AfghanAfricanAlaska NativeAlaskan AthabascanAlbanianAleutAlsatianAmericanApacheArabArapahoArgentineanArmenianAssyrian/Chaldean/SyriacAustralianAustrianBahamianBangladeshiBarbadianBasqueBelgianBelizeanBermudanBhutaneseBlackfeetBolivianBrazilianBritishBritish West IndianBulgarianBurmeseCajunCambodianCanadianCape VerdeanCarpatho RusynCelticCentral AmericanCentral American IndianCherokeeCheyenneChickasawChileanChineseChippewaChoctawColombianColvilleComancheCosta RicanCreeCreekCroatianCrowCubanCypriotCzechCzechoslovakianDanishDelawareDominicanDutchDutch West IndianEastern EuropeanEcuadorianEgyptianEnglishEstonianEthiopianEuropeanFijianFilipinoFinnishFrenchFrench American IndianFrench CanadianGermanGerman RussianGhanaianGreekGuamanian/ChamorroGuatemalanGuyaneseHaitianHmongHonduranHopiHoumaHungarianIcelanderIndian (Asian)IndonesianInupiatIranianIraqiIrishIroquoisIsraeliItalianJamaicanJapaneseJordanianKenyanKiowaKoreanLaotianLatvianLebaneseLiberianLithuanianLumbeeLuxembourgerMacedonianMalaysianMalteseMarshalleseMenomineeMexicanMexican American IndianMongolianMoroccanNative HawaiianNavajoNepaleseNew ZealanderNicaraguanNigerianNorthern EuropeanNorwegianOkinawanOsageOttawaPaiutePakistaniPalestinianPanamanianParaguayanPennsylvania GermanPeruvianPimaPolishPortuguesePotawatomiPuebloPuerto RicanPuget Sound SalishRomanianRussianSalvadoranSamoanScandinavianScotch-IrishScottishSeminoleSenegaleseSerbianShoshoneSierra LeoneanSiouxSlavicSlovakSloveneSomaliSouth AfricanSouth AmericanSouth American IndianSoviet UnionSpaniardSpanishSpanish AmericanSpanish American IndianSri LankanSubsaharan AfricanSudaneseSwedishSwissSyrianTaiwaneseThaiTlingit-HaidaTohono O'OdhamTonganTrinidadian and TobagonianTsimshianTurkishU.S. Virgin IslanderUgandanUkrainianUruguayanUteVenezuelanVietnameseWelshWest IndianYakamaYaquiYugoslavianYumanYup'ikZimbabwean
Immigration
NonimmigrantsImmigrantsAfghanistanAfricaAlbaniaArgentinaArmeniaAsiaAustraliaAustriaBahamasBangladeshBarbadosBelarusBelgiumBelizeBoliviaBosnia and HerzegovinaBrazilBulgariaBurma/MyanmarCabo VerdeCambodiaCameroonCanadaCaribbeanCentral AmericaChileChinaColombiaCongoCosta RicaCroatiaCubaCzechoslovakiaDenmarkDominicaDominican RepublicEastern AfricaEastern AsiaEastern EuropeEcuadorEgyptEl SalvadorEnglandEritreaEthiopiaEuropeFijiFranceGermanyGhanaGreeceGrenadaGuatemalaGuyanaHaitiHondurasHong KongHungaryIndiaIndonesiaIranIraqIrelandIsraelItalyJamaicaJapanJordanKazakhstanKenyaKoreaKuwaitLaosLatin AmericaLatviaLebanonLiberiaLithuaniaMalaysiaMexicoMicronesiaMiddle AfricaMoldovaMoroccoNepalNetherlandsNicaraguaNigeriaNorth AmericaNorth MacedoniaNorthern AfricaNorthern EuropeNorwayOceaniaPakistanPanamaPeruPhilippinesPortugalRomaniaRussiaSaudi ArabiaScotlandSenegalSerbiaSierra LeoneSingaporeSomaliaSouth AfricaSouth AmericaSouth Central AsiaSouth Eastern AsiaSouthern EuropeSpainSri LankaSt. Vincent and the GrenadinesSudanSwedenSwitzerlandSyriaTaiwanThailandTrinidad and TobagoTurkeyUgandaUkraineUruguayUzbekistanVenezuelaVietnamWest IndiesWestern AfricaWestern AsiaWestern EuropeYemenZaireZimbabweAzores
Immigrants from Poland
Race
Ancestry
AfricanAlaska NativeAlaskan AthabascanAlbanianAleutAlsatianAmericanApacheArabArapahoArgentineanArmenianAssyrian/Chaldean/SyriacAustralianAustrianBahamianBangladeshiBarbadianBasqueBelgianBelizeanBermudanBhutaneseBlackfeetBolivianBrazilianBritishBritish West IndianBulgarianBurmeseCajunCambodianCanadianCape VerdeanCarpatho RusynCelticCentral AmericanCentral American IndianCherokeeCheyenneChickasawChileanChineseChippewaChoctawColombianColvilleComancheCosta RicanCreeCreekCroatianCrowCubanCypriotCzechCzechoslovakianDanishDelawareDominicanDutchDutch West IndianEastern EuropeanEcuadorianEgyptianEnglishEstonianEthiopianEuropeanFijianFilipinoFinnishFrenchFrench American IndianFrench CanadianGermanGerman RussianGhanaianGreekGuamanian/ChamorroGuatemalanGuyaneseHaitianHmongHonduranHopiHoumaHungarianIcelanderIndian (Asian)IndonesianInupiatIranianIraqiIrishIroquoisIsraeliItalianJamaicanJapaneseJordanianKenyanKiowaKoreanLaotianLatvianLebaneseLiberianLithuanianLumbeeLuxembourgerMacedonianMalaysianMalteseMarshalleseMenomineeMexicanMexican American IndianMongolianMoroccanNative HawaiianNavajoNepaleseNew ZealanderNicaraguanNigerianNorthern EuropeanNorwegianOkinawanOsageOttawaPaiutePakistaniPalestinianPanamanianParaguayanPennsylvania GermanPeruvianPimaPolishPortuguesePotawatomiPuebloPuerto RicanPuget Sound SalishRomanianRussianSalvadoranSamoanScandinavianScotch-IrishScottishSeminoleSenegaleseSerbianShoshoneSierra LeoneanSiouxSlavicSlovakSloveneSomaliSouth AfricanSouth AmericanSouth American IndianSoviet UnionSpaniardSpanishSpanish AmericanSpanish American IndianSri LankanSubsaharan AfricanSudaneseSwedishSwissSyrianTaiwaneseThaiTlingit-HaidaTohono O'OdhamTonganTrinidadian and TobagonianTsimshianTurkishU.S. Virgin IslanderUgandanUkrainianUruguayanUteVenezuelanVietnameseWelshWest IndianYakamaYaquiYugoslavianYumanYup'ikZimbabwean
Immigration
NonimmigrantsImmigrantsAfghanistanAfricaAlbaniaArgentinaArmeniaAsiaAustraliaAustriaBahamasBangladeshBarbadosBelarusBelgiumBelizeBoliviaBosnia and HerzegovinaBrazilBulgariaBurma/MyanmarCabo VerdeCambodiaCameroonCanadaCaribbeanCentral AmericaChileChinaColombiaCongoCosta RicaCroatiaCubaCzechoslovakiaDenmarkDominicaDominican RepublicEastern AfricaEastern AsiaEastern EuropeEcuadorEgyptEl SalvadorEnglandEritreaEthiopiaEuropeFijiFranceGermanyGhanaGreeceGrenadaGuatemalaGuyanaHaitiHondurasHong KongHungaryIndiaIndonesiaIranIraqIrelandIsraelItalyJamaicaJapanJordanKazakhstanKenyaKoreaKuwaitLaosLatin AmericaLatviaLebanonLiberiaLithuaniaMalaysiaMexicoMicronesiaMiddle AfricaMoldovaMoroccoNepalNetherlandsNicaraguaNigeriaNorth AmericaNorth MacedoniaNorthern AfricaNorthern EuropeNorwayOceaniaPakistanPanamaPeruPhilippinesPolandPortugalRomaniaRussiaSaudi ArabiaScotlandSenegalSerbiaSierra LeoneSingaporeSomaliaSouth AfricaSouth AmericaSouth Central AsiaSouth Eastern AsiaSouthern EuropeSpainSri LankaSt. Vincent and the GrenadinesSudanSwedenSwitzerlandSyriaTaiwanThailandTrinidad and TobagoTurkeyUgandaUkraineUruguayUzbekistanVenezuelaVietnamWest IndiesWestern AfricaWestern AsiaWestern EuropeYemenZaireZimbabweAzores
College, Under 1 year
Income
Poverty
Unemployment
Labor Participation
Family Structure
Vehicle Availability
Education Level
Disability

College, Under 1 year Comparison

Afghans

Immigrants from Poland

Exceptional
Average
67.8%
COLLEGE, UNDER 1 YEAR
96.6/ 100
METRIC RATING
105th/ 347
METRIC RANK
65.2%
COLLEGE, UNDER 1 YEAR
42.6/ 100
METRIC RATING
183rd/ 347
METRIC RANK

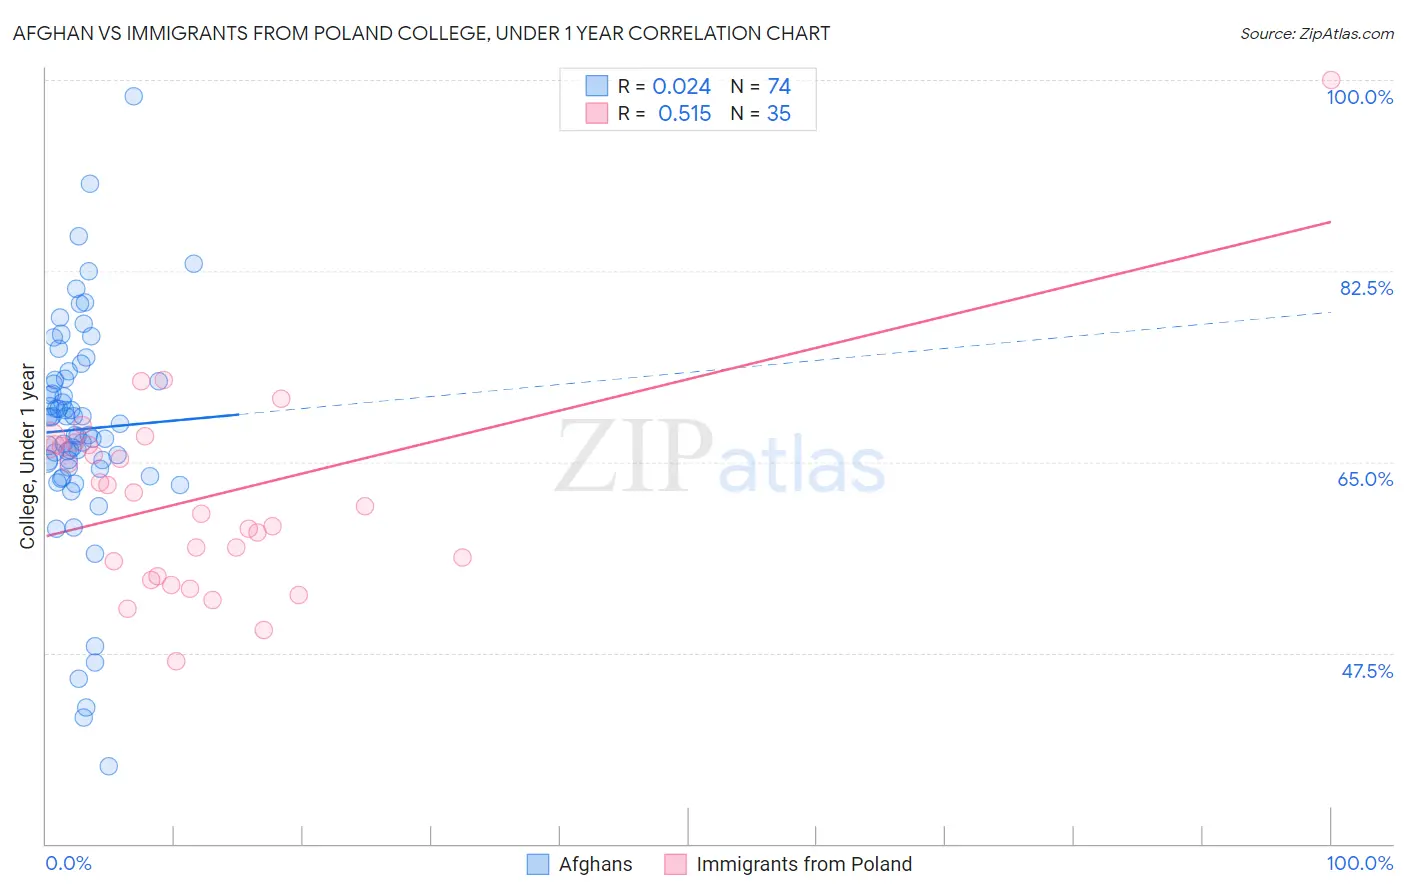
Afghan vs Immigrants from Poland College, Under 1 year Correlation Chart

The statistical analysis conducted on geographies consisting of 148,874,947 people shows no correlation between the proportion of Afghans and percentage of population with at least college, under 1 year education in the United States with a correlation coefficient (R) of 0.024 and weighted average of 67.8%. Similarly, the statistical analysis conducted on geographies consisting of 304,861,877 people shows a substantial positive correlation between the proportion of Immigrants from Poland and percentage of population with at least college, under 1 year education in the United States with a correlation coefficient (R) of 0.515 and weighted average of 65.2%, a difference of 4.0%.
Afghan vs Immigrants from Poland College, Under 1 year

College, Under 1 year Correlation Summary

MeasurementAfghanImmigrants from Poland
Minimum37.1%46.7%
Maximum98.6%100.0%
Range61.5%53.3%
Mean68.0%61.8%
Median68.0%61.0%
Interquartile 25% (IQ1)64.5%54.6%
Interquartile 75% (IQ3)72.5%66.6%
Interquartile Range (IQR)8.0%12.0%
Standard Deviation (Sample)10.2%9.4%
Standard Deviation (Population)10.2%9.3%

Similar Demographics by College, Under 1 year

Demographics Similar to Afghans by College, Under 1 year

In terms of college, under 1 year, the demographic groups most similar to Afghans are Immigrants from Western Asia (67.8%, a difference of 0.0%), Immigrants from Croatia (67.8%, a difference of 0.010%), Austrian (67.8%, a difference of 0.070%), Palestinian (67.9%, a difference of 0.080%), and Carpatho Rusyn (67.9%, a difference of 0.080%).
DemographicsRating | RankCollege, Under 1 year
Paraguayans
97.1
/100
|
#98
Exceptional
67.9%
Immigrants | Bolivia
97.0
/100
|
#99
Exceptional
67.9%
Immigrants | Argentina
97.0
/100
|
#100
Exceptional
67.9%
Immigrants | Eastern Europe
96.9
/100
|
#101
Exceptional
67.9%
Palestinians
96.9
/100
|
#102
Exceptional
67.9%
Carpatho Rusyns
96.8
/100
|
#103
Exceptional
67.9%
Immigrants | Western Asia
96.6
/100
|
#104
Exceptional
67.8%
Afghans
96.6
/100
|
#105
Exceptional
67.8%
Immigrants | Croatia
96.6
/100
|
#106
Exceptional
67.8%
Austrians
96.4
/100
|
#107
Exceptional
67.8%
Immigrants | Egypt
96.0
/100
|
#108
Exceptional
67.7%
Scandinavians
95.8
/100
|
#109
Exceptional
67.7%
Assyrians/Chaldeans/Syriacs
95.8
/100
|
#110
Exceptional
67.7%
Ukrainians
95.8
/100
|
#111
Exceptional
67.7%
Macedonians
95.7
/100
|
#112
Exceptional
67.6%

Demographics Similar to Immigrants from Poland by College, Under 1 year

In terms of college, under 1 year, the demographic groups most similar to Immigrants from Poland are Bermudan (65.2%, a difference of 0.030%), Sri Lankan (65.2%, a difference of 0.040%), Immigrants from Africa (65.3%, a difference of 0.10%), Spaniard (65.3%, a difference of 0.13%), and Immigrants from Sierra Leone (65.1%, a difference of 0.13%).
DemographicsRating | RankCollege, Under 1 year
French
48.9
/100
|
#176
Average
65.4%
Immigrants | North Macedonia
48.6
/100
|
#177
Average
65.4%
German Russians
48.3
/100
|
#178
Average
65.4%
Guamanians/Chamorros
48.2
/100
|
#179
Average
65.4%
Dutch
46.1
/100
|
#180
Average
65.3%
Spaniards
45.5
/100
|
#181
Average
65.3%
Immigrants | Africa
44.7
/100
|
#182
Average
65.3%
Immigrants | Poland
42.6
/100
|
#183
Average
65.2%
Bermudans
42.0
/100
|
#184
Average
65.2%
Sri Lankans
41.7
/100
|
#185
Average
65.2%
Immigrants | Sierra Leone
39.7
/100
|
#186
Fair
65.1%
Immigrants | Southern Europe
34.3
/100
|
#187
Fair
64.9%
Immigrants | Albania
32.0
/100
|
#188
Fair
64.9%
Spanish
31.6
/100
|
#189
Fair
64.9%
Immigrants | Philippines
30.1
/100
|
#190
Fair
64.8%