Sri Lankan vs Immigrants from Costa Rica Disability Age Under 5

COMPARE

Sri Lankan
Race
Ancestry
AfghanAfricanAlaska NativeAlaskan AthabascanAlbanianAleutAlsatianAmericanApacheArabArapahoArgentineanArmenianAssyrian/Chaldean/SyriacAustralianAustrianBahamianBangladeshiBarbadianBasqueBelgianBelizeanBermudanBhutaneseBlackfeetBolivianBrazilianBritishBritish West IndianBulgarianBurmeseCajunCambodianCanadianCape VerdeanCarpatho RusynCelticCentral AmericanCentral American IndianCherokeeCheyenneChickasawChileanChineseChippewaChoctawColombianColvilleComancheCosta RicanCreeCreekCroatianCrowCubanCypriotCzechCzechoslovakianDanishDelawareDominicanDutchDutch West IndianEastern EuropeanEcuadorianEgyptianEnglishEstonianEthiopianEuropeanFijianFilipinoFinnishFrenchFrench American IndianFrench CanadianGermanGerman RussianGhanaianGreekGuamanian/ChamorroGuatemalanGuyaneseHaitianHmongHonduranHopiHoumaHungarianIcelanderIndian (Asian)IndonesianInupiatIranianIraqiIrishIroquoisIsraeliItalianJamaicanJapaneseJordanianKenyanKiowaKoreanLaotianLatvianLebaneseLiberianLithuanianLumbeeLuxembourgerMacedonianMalaysianMalteseMarshalleseMenomineeMexicanMexican American IndianMongolianMoroccanNative HawaiianNavajoNepaleseNew ZealanderNicaraguanNigerianNorthern EuropeanNorwegianOkinawanOsageOttawaPaiutePakistaniPalestinianPanamanianParaguayanPennsylvania GermanPeruvianPimaPolishPortuguesePotawatomiPuebloPuerto RicanPuget Sound SalishRomanianRussianSalvadoranSamoanScandinavianScotch-IrishScottishSeminoleSenegaleseSerbianShoshoneSierra LeoneanSiouxSlavicSlovakSloveneSomaliSouth AfricanSouth AmericanSouth American IndianSoviet UnionSpaniardSpanishSpanish AmericanSpanish American IndianSri LankanSubsaharan AfricanSudaneseSwedishSwissSyrianTaiwaneseThaiTlingit-HaidaTohono O'OdhamTonganTrinidadian and TobagonianTsimshianTurkishU.S. Virgin IslanderUgandanUkrainianUruguayanUteVenezuelanVietnameseWelshWest IndianYakamaYaquiYugoslavianYumanYup'ikZimbabwean
Immigration
NonimmigrantsImmigrantsAfghanistanAfricaAlbaniaArgentinaArmeniaAsiaAustraliaAustriaBahamasBangladeshBarbadosBelarusBelgiumBelizeBoliviaBosnia and HerzegovinaBrazilBulgariaBurma/MyanmarCabo VerdeCambodiaCameroonCanadaCaribbeanCentral AmericaChileChinaColombiaCongoCroatiaCubaCzechoslovakiaDenmarkDominicaDominican RepublicEastern AfricaEastern AsiaEastern EuropeEcuadorEgyptEl SalvadorEnglandEritreaEthiopiaEuropeFijiFranceGermanyGhanaGreeceGrenadaGuatemalaGuyanaHaitiHondurasHong KongHungaryIndiaIndonesiaIranIraqIrelandIsraelItalyJamaicaJapanJordanKazakhstanKenyaKoreaKuwaitLaosLatin AmericaLatviaLebanonLiberiaLithuaniaMalaysiaMexicoMicronesiaMiddle AfricaMoldovaMoroccoNepalNetherlandsNicaraguaNigeriaNorth AmericaNorth MacedoniaNorthern AfricaNorthern EuropeNorwayOceaniaPakistanPanamaPeruPhilippinesPolandPortugalRomaniaRussiaSaudi ArabiaScotlandSenegalSerbiaSierra LeoneSingaporeSomaliaSouth AfricaSouth AmericaSouth Central AsiaSouth Eastern AsiaSouthern EuropeSpainSri LankaSt. Vincent and the GrenadinesSudanSwedenSwitzerlandSyriaTaiwanThailandTrinidad and TobagoTurkeyUgandaUkraineUruguayUzbekistanVenezuelaVietnamWest IndiesWestern AfricaWestern AsiaWestern EuropeYemenZaireZimbabweAzores
Immigrants from Costa Rica
Race
Ancestry
AfghanAfricanAlaska NativeAlaskan AthabascanAlbanianAleutAlsatianAmericanApacheArabArapahoArgentineanArmenianAssyrian/Chaldean/SyriacAustralianAustrianBahamianBangladeshiBarbadianBasqueBelgianBelizeanBermudanBhutaneseBlackfeetBolivianBrazilianBritishBritish West IndianBulgarianBurmeseCajunCambodianCanadianCape VerdeanCarpatho RusynCelticCentral AmericanCentral American IndianCherokeeCheyenneChickasawChileanChineseChippewaChoctawColombianColvilleComancheCosta RicanCreeCreekCroatianCrowCubanCypriotCzechCzechoslovakianDanishDelawareDominicanDutchDutch West IndianEastern EuropeanEcuadorianEgyptianEnglishEstonianEthiopianEuropeanFijianFilipinoFinnishFrenchFrench American IndianFrench CanadianGermanGerman RussianGhanaianGreekGuamanian/ChamorroGuatemalanGuyaneseHaitianHmongHonduranHopiHoumaHungarianIcelanderIndian (Asian)IndonesianInupiatIranianIraqiIrishIroquoisIsraeliItalianJamaicanJapaneseJordanianKenyanKiowaKoreanLaotianLatvianLebaneseLiberianLithuanianLumbeeLuxembourgerMacedonianMalaysianMalteseMarshalleseMenomineeMexicanMexican American IndianMongolianMoroccanNative HawaiianNavajoNepaleseNew ZealanderNicaraguanNigerianNorthern EuropeanNorwegianOkinawanOsageOttawaPaiutePakistaniPalestinianPanamanianParaguayanPennsylvania GermanPeruvianPimaPolishPortuguesePotawatomiPuebloPuerto RicanPuget Sound SalishRomanianRussianSalvadoranSamoanScandinavianScotch-IrishScottishSeminoleSenegaleseSerbianShoshoneSierra LeoneanSiouxSlavicSlovakSloveneSomaliSouth AfricanSouth AmericanSouth American IndianSoviet UnionSpaniardSpanishSpanish AmericanSpanish American IndianSubsaharan AfricanSudaneseSwedishSwissSyrianTaiwaneseThaiTlingit-HaidaTohono O'OdhamTonganTrinidadian and TobagonianTsimshianTurkishU.S. Virgin IslanderUgandanUkrainianUruguayanUteVenezuelanVietnameseWelshWest IndianYakamaYaquiYugoslavianYumanYup'ikZimbabwean
Immigration
NonimmigrantsImmigrantsAfghanistanAfricaAlbaniaArgentinaArmeniaAsiaAustraliaAustriaBahamasBangladeshBarbadosBelarusBelgiumBelizeBoliviaBosnia and HerzegovinaBrazilBulgariaBurma/MyanmarCabo VerdeCambodiaCameroonCanadaCaribbeanCentral AmericaChileChinaColombiaCongoCosta RicaCroatiaCubaCzechoslovakiaDenmarkDominicaDominican RepublicEastern AfricaEastern AsiaEastern EuropeEcuadorEgyptEl SalvadorEnglandEritreaEthiopiaEuropeFijiFranceGermanyGhanaGreeceGrenadaGuatemalaGuyanaHaitiHondurasHong KongHungaryIndiaIndonesiaIranIraqIrelandIsraelItalyJamaicaJapanJordanKazakhstanKenyaKoreaKuwaitLaosLatin AmericaLatviaLebanonLiberiaLithuaniaMalaysiaMexicoMicronesiaMiddle AfricaMoldovaMoroccoNepalNetherlandsNicaraguaNigeriaNorth AmericaNorth MacedoniaNorthern AfricaNorthern EuropeNorwayOceaniaPakistanPanamaPeruPhilippinesPolandPortugalRomaniaRussiaSaudi ArabiaScotlandSenegalSerbiaSierra LeoneSingaporeSomaliaSouth AfricaSouth AmericaSouth Central AsiaSouth Eastern AsiaSouthern EuropeSpainSri LankaSt. Vincent and the GrenadinesSudanSwedenSwitzerlandSyriaTaiwanThailandTrinidad and TobagoTurkeyUgandaUkraineUruguayUzbekistanVenezuelaVietnamWest IndiesWestern AfricaWestern AsiaWestern EuropeYemenZaireZimbabweAzores
Disability Age Under 5
Income
Poverty
Unemployment
Labor Participation
Family Structure
Vehicle Availability
Education Level
Disability

Disability Age Under 5 Comparison

Sri Lankans

Immigrants from Costa Rica

Exceptional
Tragic
1.1%
DISABILITY AGE UNDER 5
96.8/ 100
METRIC RATING
94th/ 347
METRIC RANK
1.3%
DISABILITY AGE UNDER 5
5.5/ 100
METRIC RATING
229th/ 347
METRIC RANK

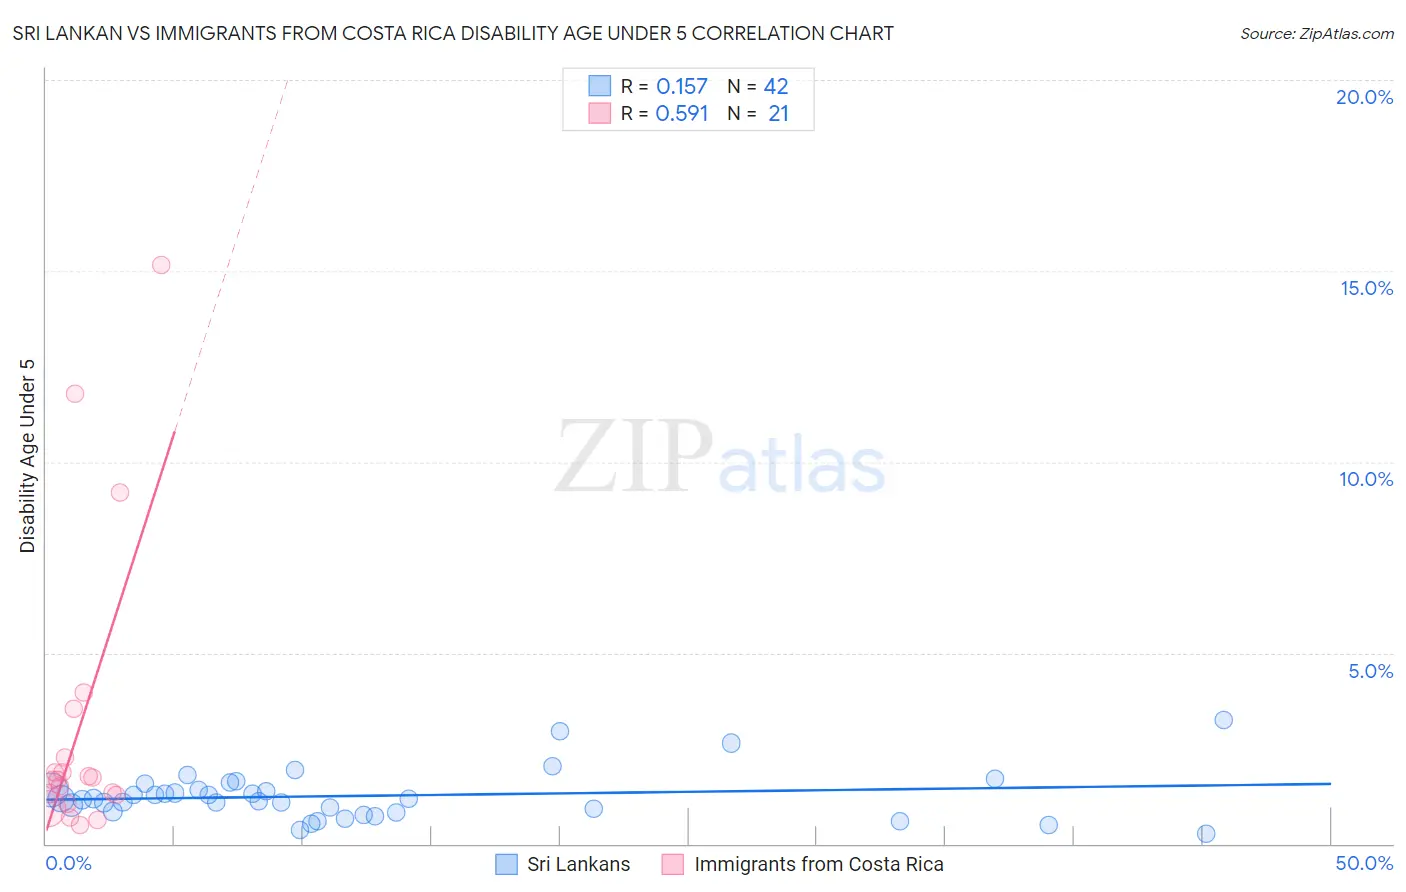
Sri Lankan vs Immigrants from Costa Rica Disability Age Under 5 Correlation Chart

The statistical analysis conducted on geographies consisting of 232,959,648 people shows a poor positive correlation between the proportion of Sri Lankans and percentage of population with a disability under the age of 5 in the United States with a correlation coefficient (R) of 0.157 and weighted average of 1.1%. Similarly, the statistical analysis conducted on geographies consisting of 133,028,674 people shows a substantial positive correlation between the proportion of Immigrants from Costa Rica and percentage of population with a disability under the age of 5 in the United States with a correlation coefficient (R) of 0.591 and weighted average of 1.3%, a difference of 15.4%.
Sri Lankan vs Immigrants from Costa Rica Disability Age Under 5

Disability Age Under 5 Correlation Summary

MeasurementSri LankanImmigrants from Costa Rica
Minimum0.25%0.49%
Maximum3.2%15.2%
Range3.0%14.7%
Mean1.3%3.1%
Median1.2%1.7%
Interquartile 25% (IQ1)0.84%1.2%
Interquartile 75% (IQ3)1.4%2.9%
Interquartile Range (IQR)0.57%1.7%
Standard Deviation (Sample)0.63%3.9%
Standard Deviation (Population)0.62%3.8%

Similar Demographics by Disability Age Under 5

Demographics Similar to Sri Lankans by Disability Age Under 5

In terms of disability age under 5, the demographic groups most similar to Sri Lankans are Immigrants from Moldova (1.1%, a difference of 0.050%), Spanish American (1.1%, a difference of 0.060%), Immigrants from Cuba (1.1%, a difference of 0.090%), Mongolian (1.1%, a difference of 0.16%), and Albanian (1.1%, a difference of 0.26%).
DemographicsRating | RankDisability Age Under 5
Ugandans
97.5
/100
|
#87
Exceptional
1.1%
Immigrants | Dominican Republic
97.5
/100
|
#88
Exceptional
1.1%
Ethiopians
97.2
/100
|
#89
Exceptional
1.1%
Chinese
97.2
/100
|
#90
Exceptional
1.1%
Albanians
97.2
/100
|
#91
Exceptional
1.1%
Immigrants | Cuba
97.0
/100
|
#92
Exceptional
1.1%
Spanish Americans
96.9
/100
|
#93
Exceptional
1.1%
Sri Lankans
96.8
/100
|
#94
Exceptional
1.1%
Immigrants | Moldova
96.8
/100
|
#95
Exceptional
1.1%
Mongolians
96.6
/100
|
#96
Exceptional
1.1%
Immigrants | Iraq
96.5
/100
|
#97
Exceptional
1.1%
Immigrants | South Eastern Asia
96.5
/100
|
#98
Exceptional
1.1%
Dominicans
96.3
/100
|
#99
Exceptional
1.1%
Nicaraguans
96.3
/100
|
#100
Exceptional
1.1%
Immigrants | Uganda
96.1
/100
|
#101
Exceptional
1.1%

Demographics Similar to Immigrants from Costa Rica by Disability Age Under 5

In terms of disability age under 5, the demographic groups most similar to Immigrants from Costa Rica are Lebanese (1.3%, a difference of 0.10%), Luxembourger (1.3%, a difference of 0.21%), Taiwanese (1.3%, a difference of 0.23%), Immigrants from Northern Europe (1.3%, a difference of 0.34%), and French American Indian (1.3%, a difference of 0.47%).
DemographicsRating | RankDisability Age Under 5
Ukrainians
8.3
/100
|
#222
Tragic
1.3%
Hispanics or Latinos
7.7
/100
|
#223
Tragic
1.3%
Latvians
7.1
/100
|
#224
Tragic
1.3%
Panamanians
7.1
/100
|
#225
Tragic
1.3%
Bahamians
7.1
/100
|
#226
Tragic
1.3%
Taiwanese
6.1
/100
|
#227
Tragic
1.3%
Luxembourgers
6.1
/100
|
#228
Tragic
1.3%
Immigrants | Costa Rica
5.5
/100
|
#229
Tragic
1.3%
Lebanese
5.3
/100
|
#230
Tragic
1.3%
Immigrants | Northern Europe
4.7
/100
|
#231
Tragic
1.3%
French American Indians
4.5
/100
|
#232
Tragic
1.3%
Tongans
4.2
/100
|
#233
Tragic
1.3%
Pueblo
3.8
/100
|
#234
Tragic
1.3%
Central American Indians
3.6
/100
|
#235
Tragic
1.3%
South American Indians
3.3
/100
|
#236
Tragic
1.3%