Pima vs Nicaraguan Male Disability
COMPARE
Pima
Nicaraguan
Male Disability
Male Disability Comparison
Pima
Nicaraguans
12.8%
MALE DISABILITY
0.0/ 100
METRIC RATING
290th/ 347
METRIC RANK
10.7%
MALE DISABILITY
96.6/ 100
METRIC RATING
96th/ 347
METRIC RANK
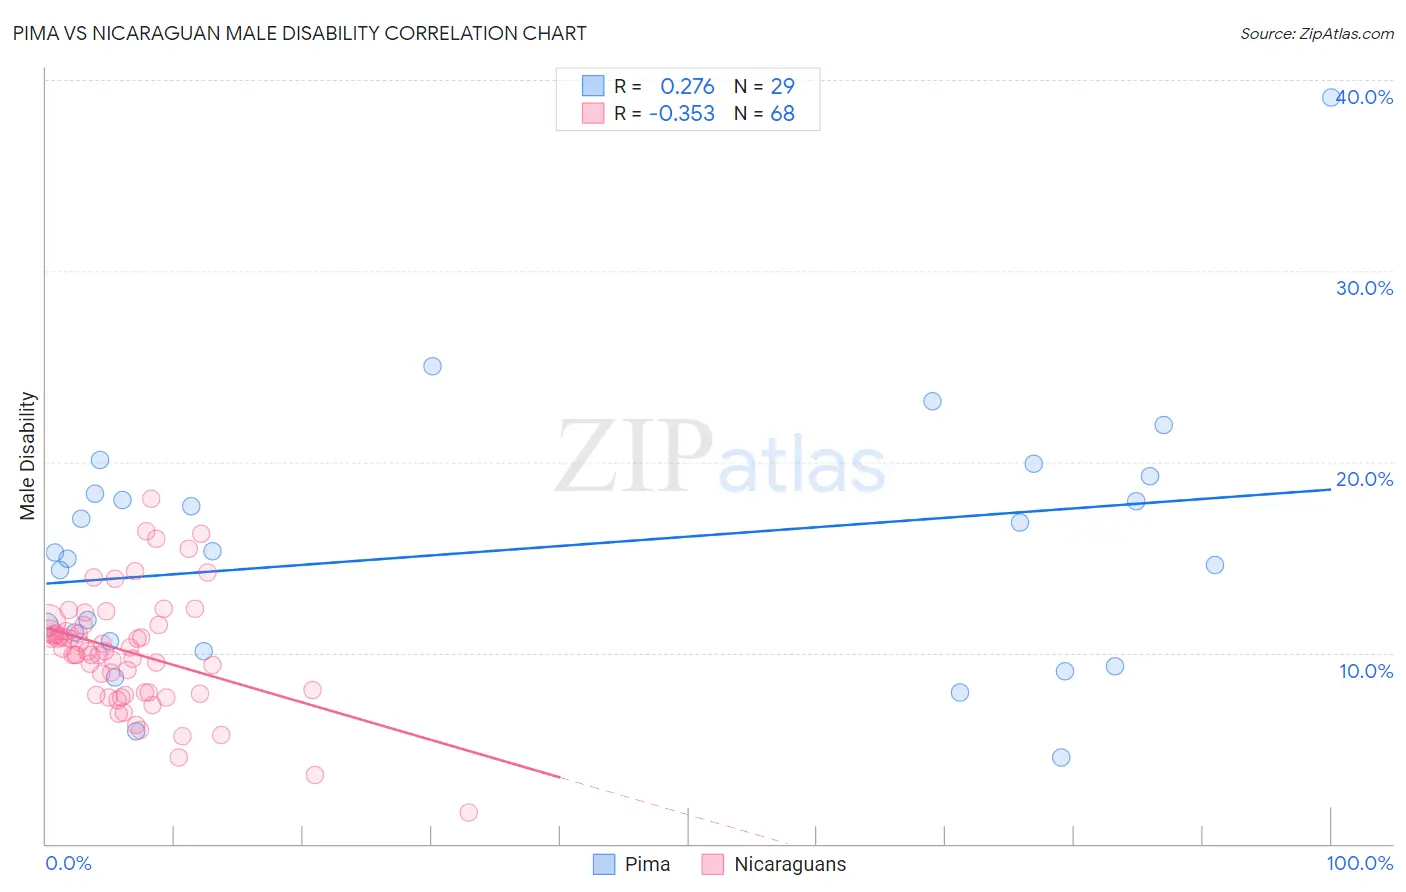
Pima vs Nicaraguan Male Disability Correlation Chart
The statistical analysis conducted on geographies consisting of 61,540,793 people shows a weak positive correlation between the proportion of Pima and percentage of males with a disability in the United States with a correlation coefficient (R) of 0.276 and weighted average of 12.8%. Similarly, the statistical analysis conducted on geographies consisting of 285,689,446 people shows a mild negative correlation between the proportion of Nicaraguans and percentage of males with a disability in the United States with a correlation coefficient (R) of -0.353 and weighted average of 10.7%, a difference of 20.0%.
Male Disability Correlation Summary
| Measurement | Pima | Nicaraguan |
| Minimum | 4.5% | 1.6% |
| Maximum | 39.1% | 18.1% |
| Range | 34.6% | 16.5% |
| Mean | 15.5% | 10.0% |
| Median | 15.3% | 10.1% |
| Interquartile 25% (IQ1) | 10.3% | 7.9% |
| Interquartile 75% (IQ3) | 18.8% | 11.3% |
| Interquartile Range (IQR) | 8.5% | 3.4% |
| Standard Deviation (Sample) | 6.9% | 3.0% |
| Standard Deviation (Population) | 6.8% | 3.0% |
Similar Demographics by Male Disability
Demographics Similar to Pima by Male Disability
In terms of male disability, the demographic groups most similar to Pima are White/Caucasian (12.8%, a difference of 0.090%), Immigrants from Cabo Verde (12.8%, a difference of 0.15%), English (12.8%, a difference of 0.15%), Yup'ik (12.8%, a difference of 0.34%), and Yaqui (12.9%, a difference of 0.44%).
| Demographics | Rating | Rank | Male Disability |
| Germans | 0.0 /100 | #283 | Tragic 12.7% |
| Spanish | 0.0 /100 | #284 | Tragic 12.7% |
| Welsh | 0.0 /100 | #285 | Tragic 12.7% |
| Scottish | 0.0 /100 | #286 | Tragic 12.8% |
| Cape Verdeans | 0.0 /100 | #287 | Tragic 12.8% |
| Yup'ik | 0.0 /100 | #288 | Tragic 12.8% |
| Immigrants | Cabo Verde | 0.0 /100 | #289 | Tragic 12.8% |
| Pima | 0.0 /100 | #290 | Tragic 12.8% |
| Whites/Caucasians | 0.0 /100 | #291 | Tragic 12.8% |
| English | 0.0 /100 | #292 | Tragic 12.8% |
| Yaqui | 0.0 /100 | #293 | Tragic 12.9% |
| Marshallese | 0.0 /100 | #294 | Tragic 12.9% |
| Immigrants | Micronesia | 0.0 /100 | #295 | Tragic 12.9% |
| Immigrants | Nonimmigrants | 0.0 /100 | #296 | Tragic 12.9% |
| Inupiat | 0.0 /100 | #297 | Tragic 13.0% |
Demographics Similar to Nicaraguans by Male Disability
In terms of male disability, the demographic groups most similar to Nicaraguans are Immigrants from Armenia (10.7%, a difference of 0.020%), Immigrants from Romania (10.7%, a difference of 0.080%), Chilean (10.7%, a difference of 0.10%), Immigrants from Sweden (10.7%, a difference of 0.13%), and Immigrants from Switzerland (10.7%, a difference of 0.22%).
| Demographics | Rating | Rank | Male Disability |
| Immigrants | Nicaragua | 97.8 /100 | #89 | Exceptional 10.6% |
| Immigrants | Morocco | 97.7 /100 | #90 | Exceptional 10.6% |
| Immigrants | France | 97.6 /100 | #91 | Exceptional 10.6% |
| Palestinians | 97.4 /100 | #92 | Exceptional 10.7% |
| Immigrants | St. Vincent and the Grenadines | 97.1 /100 | #93 | Exceptional 10.7% |
| Immigrants | Sweden | 96.9 /100 | #94 | Exceptional 10.7% |
| Chileans | 96.9 /100 | #95 | Exceptional 10.7% |
| Nicaraguans | 96.6 /100 | #96 | Exceptional 10.7% |
| Immigrants | Armenia | 96.6 /100 | #97 | Exceptional 10.7% |
| Immigrants | Romania | 96.5 /100 | #98 | Exceptional 10.7% |
| Immigrants | Switzerland | 96.1 /100 | #99 | Exceptional 10.7% |
| Immigrants | Kazakhstan | 95.9 /100 | #100 | Exceptional 10.7% |
| Immigrants | Greece | 95.6 /100 | #101 | Exceptional 10.7% |
| Immigrants | Eastern Europe | 95.3 /100 | #102 | Exceptional 10.7% |
| Uruguayans | 95.3 /100 | #103 | Exceptional 10.7% |