Pennsylvania German vs Immigrants from El Salvador Female Disability
COMPARE
Pennsylvania German
Immigrants from El Salvador
Female Disability
Female Disability Comparison
Pennsylvania Germans
Immigrants from El Salvador
13.4%
FEMALE DISABILITY
0.0/ 100
METRIC RATING
300th/ 347
METRIC RANK
11.4%
FEMALE DISABILITY
99.9/ 100
METRIC RATING
64th/ 347
METRIC RANK
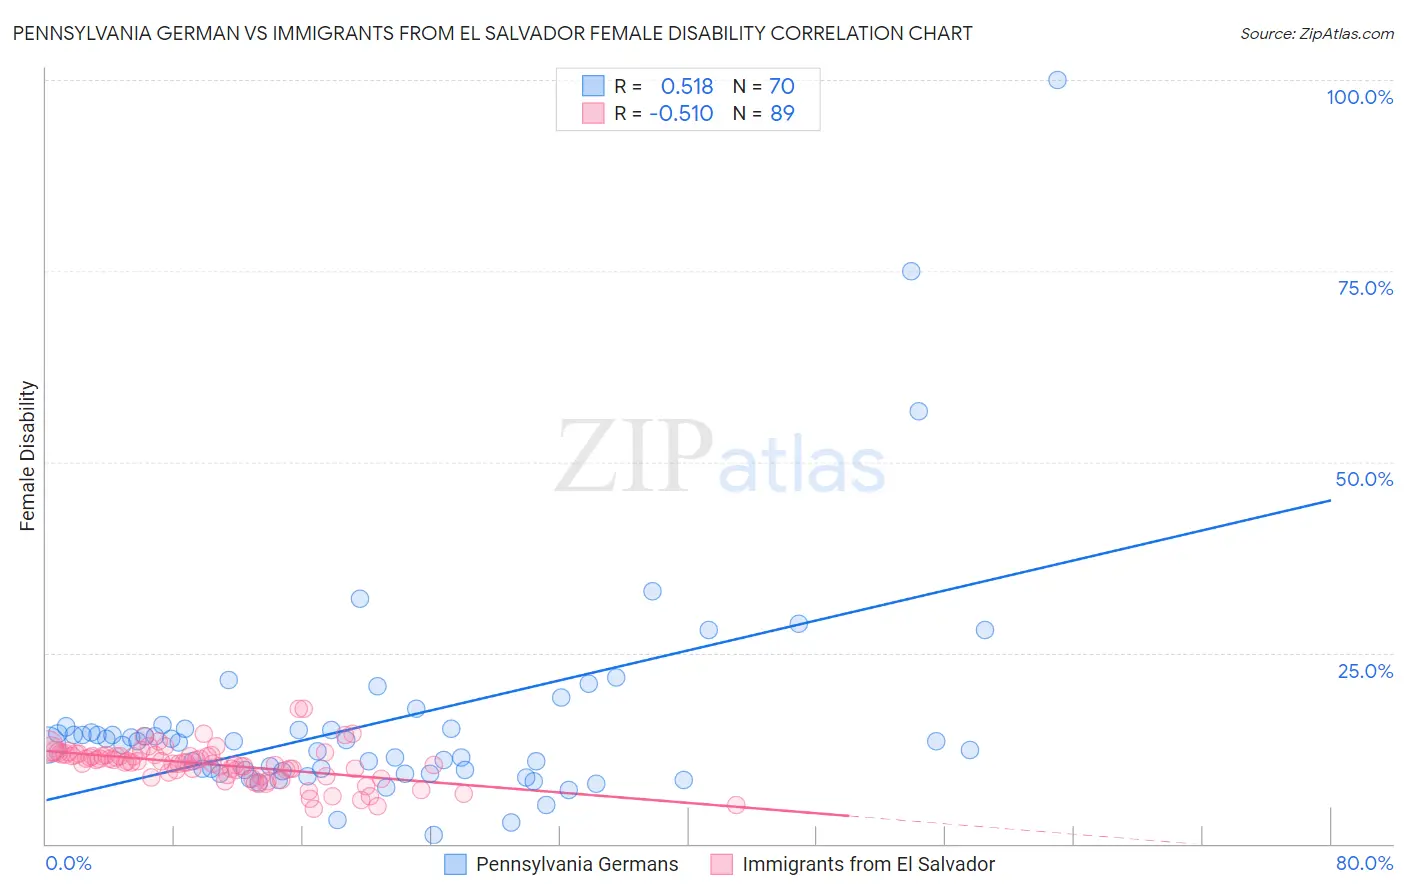
Pennsylvania German vs Immigrants from El Salvador Female Disability Correlation Chart
The statistical analysis conducted on geographies consisting of 234,097,367 people shows a substantial positive correlation between the proportion of Pennsylvania Germans and percentage of females with a disability in the United States with a correlation coefficient (R) of 0.518 and weighted average of 13.4%. Similarly, the statistical analysis conducted on geographies consisting of 357,763,756 people shows a substantial negative correlation between the proportion of Immigrants from El Salvador and percentage of females with a disability in the United States with a correlation coefficient (R) of -0.510 and weighted average of 11.4%, a difference of 17.2%.
Female Disability Correlation Summary
| Measurement | Pennsylvania German | Immigrants from El Salvador |
| Minimum | 1.2% | 4.5% |
| Maximum | 100.0% | 17.7% |
| Range | 98.8% | 13.2% |
| Mean | 16.0% | 10.4% |
| Median | 13.3% | 10.6% |
| Interquartile 25% (IQ1) | 9.4% | 8.9% |
| Interquartile 75% (IQ3) | 15.1% | 11.6% |
| Interquartile Range (IQR) | 5.6% | 2.7% |
| Standard Deviation (Sample) | 14.9% | 2.4% |
| Standard Deviation (Population) | 14.8% | 2.4% |
Similar Demographics by Female Disability
Demographics Similar to Pennsylvania Germans by Female Disability
In terms of female disability, the demographic groups most similar to Pennsylvania Germans are Immigrants from Dominican Republic (13.4%, a difference of 0.010%), African (13.4%, a difference of 0.20%), Nonimmigrants (13.4%, a difference of 0.27%), Scotch-Irish (13.4%, a difference of 0.34%), and Immigrants from Portugal (13.5%, a difference of 0.34%).
| Demographics | Rating | Rank | Female Disability |
| Marshallese | 0.0 /100 | #293 | Tragic 13.3% |
| Celtics | 0.0 /100 | #294 | Tragic 13.3% |
| French | 0.0 /100 | #295 | Tragic 13.3% |
| Nepalese | 0.0 /100 | #296 | Tragic 13.3% |
| Slovaks | 0.0 /100 | #297 | Tragic 13.3% |
| Immigrants | Nonimmigrants | 0.0 /100 | #298 | Tragic 13.4% |
| Immigrants | Dominican Republic | 0.0 /100 | #299 | Tragic 13.4% |
| Pennsylvania Germans | 0.0 /100 | #300 | Tragic 13.4% |
| Africans | 0.0 /100 | #301 | Tragic 13.4% |
| Scotch-Irish | 0.0 /100 | #302 | Tragic 13.4% |
| Immigrants | Portugal | 0.0 /100 | #303 | Tragic 13.5% |
| Immigrants | Micronesia | 0.0 /100 | #304 | Tragic 13.5% |
| Dominicans | 0.0 /100 | #305 | Tragic 13.5% |
| French Canadians | 0.0 /100 | #306 | Tragic 13.6% |
| Central American Indians | 0.0 /100 | #307 | Tragic 13.6% |
Demographics Similar to Immigrants from El Salvador by Female Disability
In terms of female disability, the demographic groups most similar to Immigrants from El Salvador are Immigrants from South America (11.4%, a difference of 0.020%), Immigrants from Colombia (11.4%, a difference of 0.070%), Sri Lankan (11.4%, a difference of 0.17%), Salvadoran (11.5%, a difference of 0.19%), and Immigrants from Vietnam (11.5%, a difference of 0.24%).
| Demographics | Rating | Rank | Female Disability |
| South Americans | 99.9 /100 | #57 | Exceptional 11.4% |
| Laotians | 99.9 /100 | #58 | Exceptional 11.4% |
| Immigrants | Spain | 99.9 /100 | #59 | Exceptional 11.4% |
| Immigrants | Bulgaria | 99.9 /100 | #60 | Exceptional 11.4% |
| Immigrants | France | 99.9 /100 | #61 | Exceptional 11.4% |
| Sri Lankans | 99.9 /100 | #62 | Exceptional 11.4% |
| Immigrants | Colombia | 99.9 /100 | #63 | Exceptional 11.4% |
| Immigrants | El Salvador | 99.9 /100 | #64 | Exceptional 11.4% |
| Immigrants | South America | 99.9 /100 | #65 | Exceptional 11.4% |
| Salvadorans | 99.8 /100 | #66 | Exceptional 11.5% |
| Immigrants | Vietnam | 99.8 /100 | #67 | Exceptional 11.5% |
| Immigrants | Northern Africa | 99.8 /100 | #68 | Exceptional 11.5% |
| Colombians | 99.8 /100 | #69 | Exceptional 11.5% |
| Immigrants | Chile | 99.8 /100 | #70 | Exceptional 11.5% |
| Immigrants | Ireland | 99.8 /100 | #71 | Exceptional 11.5% |