Paiute vs Peruvian Ambulatory Disability
COMPARE
Paiute
Peruvian
Ambulatory Disability
Ambulatory Disability Comparison
Paiute
Peruvians
7.7%
AMBULATORY DISABILITY
0.0/ 100
METRIC RATING
330th/ 347
METRIC RANK
5.7%
AMBULATORY DISABILITY
99.5/ 100
METRIC RATING
69th/ 347
METRIC RANK
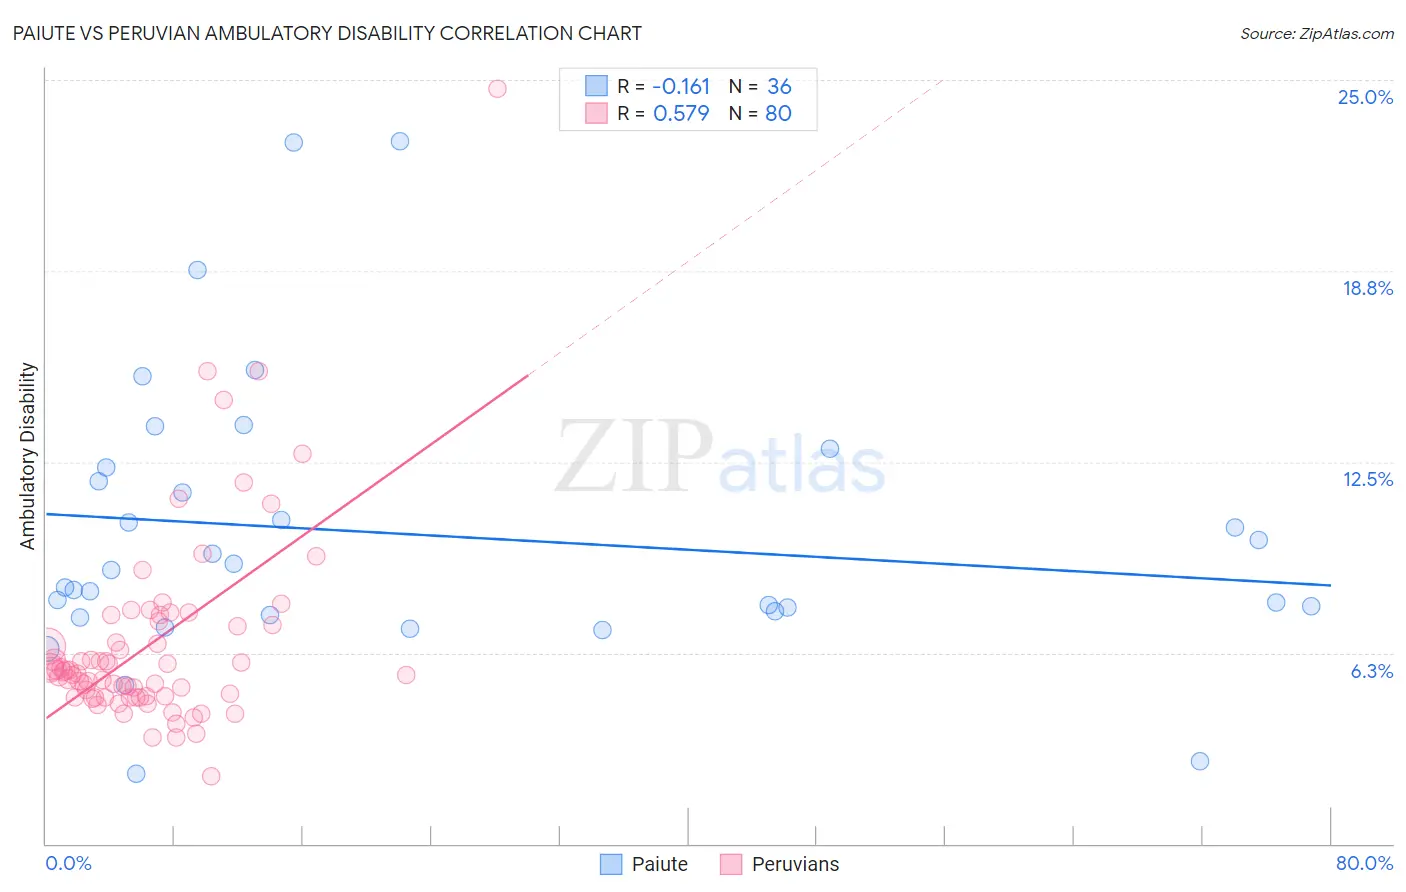
Paiute vs Peruvian Ambulatory Disability Correlation Chart
The statistical analysis conducted on geographies consisting of 58,391,383 people shows a poor negative correlation between the proportion of Paiute and percentage of population with ambulatory disability in the United States with a correlation coefficient (R) of -0.161 and weighted average of 7.7%. Similarly, the statistical analysis conducted on geographies consisting of 363,114,873 people shows a substantial positive correlation between the proportion of Peruvians and percentage of population with ambulatory disability in the United States with a correlation coefficient (R) of 0.579 and weighted average of 5.7%, a difference of 35.2%.
Ambulatory Disability Correlation Summary
| Measurement | Paiute | Peruvian |
| Minimum | 2.3% | 2.2% |
| Maximum | 23.0% | 24.7% |
| Range | 20.7% | 22.5% |
| Mean | 10.1% | 6.6% |
| Median | 8.7% | 5.7% |
| Interquartile 25% (IQ1) | 7.5% | 4.8% |
| Interquartile 75% (IQ3) | 12.1% | 7.2% |
| Interquartile Range (IQR) | 4.5% | 2.4% |
| Standard Deviation (Sample) | 4.6% | 3.3% |
| Standard Deviation (Population) | 4.6% | 3.3% |
Similar Demographics by Ambulatory Disability
Demographics Similar to Paiute by Ambulatory Disability
In terms of ambulatory disability, the demographic groups most similar to Paiute are Cajun (7.8%, a difference of 1.2%), Pueblo (7.6%, a difference of 1.3%), Hopi (7.6%, a difference of 1.3%), Menominee (7.8%, a difference of 1.5%), and Native/Alaskan (7.5%, a difference of 2.2%).
| Demographics | Rating | Rank | Ambulatory Disability |
| Americans | 0.0 /100 | #323 | Tragic 7.4% |
| Navajo | 0.0 /100 | #324 | Tragic 7.5% |
| Comanche | 0.0 /100 | #325 | Tragic 7.5% |
| Blacks/African Americans | 0.0 /100 | #326 | Tragic 7.5% |
| Natives/Alaskans | 0.0 /100 | #327 | Tragic 7.5% |
| Hopi | 0.0 /100 | #328 | Tragic 7.6% |
| Pueblo | 0.0 /100 | #329 | Tragic 7.6% |
| Paiute | 0.0 /100 | #330 | Tragic 7.7% |
| Cajuns | 0.0 /100 | #331 | Tragic 7.8% |
| Menominee | 0.0 /100 | #332 | Tragic 7.8% |
| Cherokee | 0.0 /100 | #333 | Tragic 7.9% |
| Yuman | 0.0 /100 | #334 | Tragic 7.9% |
| Chickasaw | 0.0 /100 | #335 | Tragic 8.0% |
| Seminole | 0.0 /100 | #336 | Tragic 8.0% |
| Dutch West Indians | 0.0 /100 | #337 | Tragic 8.2% |
Demographics Similar to Peruvians by Ambulatory Disability
In terms of ambulatory disability, the demographic groups most similar to Peruvians are Sierra Leonean (5.7%, a difference of 0.23%), Immigrants from Peru (5.7%, a difference of 0.32%), Brazilian (5.7%, a difference of 0.34%), Immigrants from Northern Africa (5.7%, a difference of 0.36%), and Immigrants from Cameroon (5.7%, a difference of 0.36%).
| Demographics | Rating | Rank | Ambulatory Disability |
| Immigrants | Spain | 99.7 /100 | #62 | Exceptional 5.6% |
| Immigrants | France | 99.7 /100 | #63 | Exceptional 5.6% |
| Laotians | 99.7 /100 | #64 | Exceptional 5.7% |
| Immigrants | Switzerland | 99.7 /100 | #65 | Exceptional 5.7% |
| Israelis | 99.6 /100 | #66 | Exceptional 5.7% |
| Immigrants | Uganda | 99.6 /100 | #67 | Exceptional 5.7% |
| Sri Lankans | 99.6 /100 | #68 | Exceptional 5.7% |
| Peruvians | 99.5 /100 | #69 | Exceptional 5.7% |
| Sierra Leoneans | 99.4 /100 | #70 | Exceptional 5.7% |
| Immigrants | Peru | 99.4 /100 | #71 | Exceptional 5.7% |
| Brazilians | 99.4 /100 | #72 | Exceptional 5.7% |
| Immigrants | Northern Africa | 99.4 /100 | #73 | Exceptional 5.7% |
| Immigrants | Cameroon | 99.4 /100 | #74 | Exceptional 5.7% |
| Immigrants | South Africa | 99.3 /100 | #75 | Exceptional 5.7% |
| Sudanese | 99.3 /100 | #76 | Exceptional 5.7% |