Northern European vs Immigrants from Eritrea Male Disability
COMPARE
Northern European
Immigrants from Eritrea
Male Disability
Male Disability Comparison
Northern Europeans
Immigrants from Eritrea
11.9%
MALE DISABILITY
1.1/ 100
METRIC RATING
242nd/ 347
METRIC RANK
10.4%
MALE DISABILITY
99.6/ 100
METRIC RATING
55th/ 347
METRIC RANK
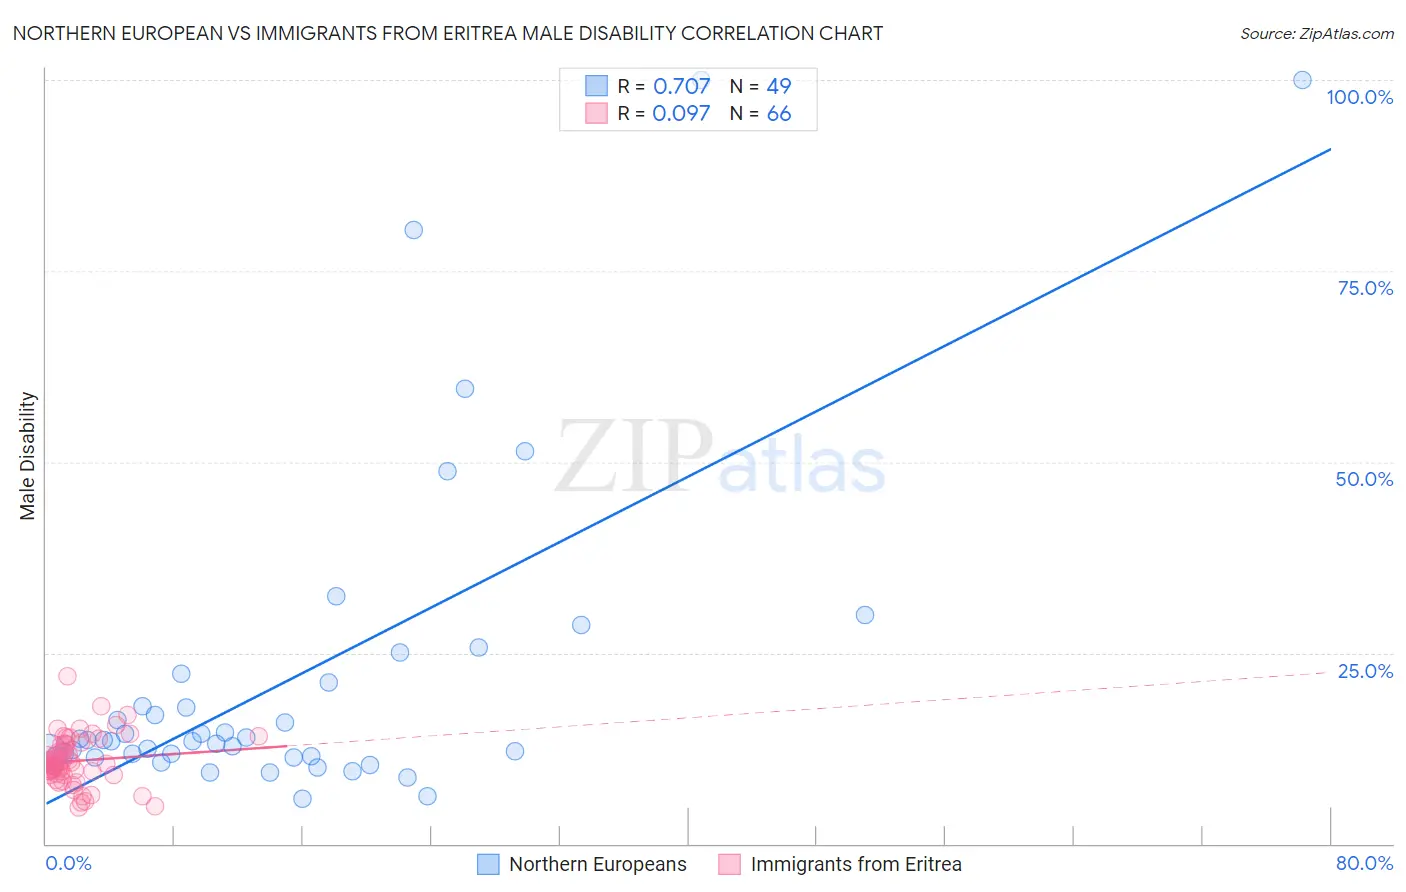
Northern European vs Immigrants from Eritrea Male Disability Correlation Chart
The statistical analysis conducted on geographies consisting of 406,040,370 people shows a strong positive correlation between the proportion of Northern Europeans and percentage of males with a disability in the United States with a correlation coefficient (R) of 0.707 and weighted average of 11.9%. Similarly, the statistical analysis conducted on geographies consisting of 104,852,788 people shows a slight positive correlation between the proportion of Immigrants from Eritrea and percentage of males with a disability in the United States with a correlation coefficient (R) of 0.097 and weighted average of 10.4%, a difference of 14.9%.
Male Disability Correlation Summary
| Measurement | Northern European | Immigrants from Eritrea |
| Minimum | 5.8% | 4.7% |
| Maximum | 100.0% | 22.0% |
| Range | 94.2% | 17.3% |
| Mean | 21.8% | 10.8% |
| Median | 13.6% | 10.4% |
| Interquartile 25% (IQ1) | 11.5% | 9.2% |
| Interquartile 75% (IQ3) | 21.7% | 13.0% |
| Interquartile Range (IQR) | 10.3% | 3.8% |
| Standard Deviation (Sample) | 21.6% | 3.2% |
| Standard Deviation (Population) | 21.4% | 3.1% |
Similar Demographics by Male Disability
Demographics Similar to Northern Europeans by Male Disability
In terms of male disability, the demographic groups most similar to Northern Europeans are Bahamian (11.9%, a difference of 0.010%), Samoan (11.9%, a difference of 0.030%), Czech (11.9%, a difference of 0.050%), Italian (11.9%, a difference of 0.10%), and Immigrants from Laos (11.9%, a difference of 0.14%).
| Demographics | Rating | Rank | Male Disability |
| Immigrants | North America | 1.5 /100 | #235 | Tragic 11.9% |
| U.S. Virgin Islanders | 1.3 /100 | #236 | Tragic 11.9% |
| Carpatho Rusyns | 1.3 /100 | #237 | Tragic 11.9% |
| Yugoslavians | 1.2 /100 | #238 | Tragic 11.9% |
| Italians | 1.2 /100 | #239 | Tragic 11.9% |
| Czechs | 1.1 /100 | #240 | Tragic 11.9% |
| Bahamians | 1.1 /100 | #241 | Tragic 11.9% |
| Northern Europeans | 1.1 /100 | #242 | Tragic 11.9% |
| Samoans | 1.1 /100 | #243 | Tragic 11.9% |
| Immigrants | Laos | 1.0 /100 | #244 | Tragic 11.9% |
| Immigrants | Liberia | 1.0 /100 | #245 | Tragic 11.9% |
| Danes | 0.9 /100 | #246 | Tragic 11.9% |
| Hungarians | 0.8 /100 | #247 | Tragic 12.0% |
| Poles | 0.7 /100 | #248 | Tragic 12.0% |
| Immigrants | Yemen | 0.5 /100 | #249 | Tragic 12.0% |
Demographics Similar to Immigrants from Eritrea by Male Disability
In terms of male disability, the demographic groups most similar to Immigrants from Eritrea are Peruvian (10.4%, a difference of 0.020%), Tongan (10.4%, a difference of 0.040%), Immigrants from Uzbekistan (10.4%, a difference of 0.060%), Immigrants from South America (10.4%, a difference of 0.060%), and Immigrants from Saudi Arabia (10.4%, a difference of 0.080%).
| Demographics | Rating | Rank | Male Disability |
| Israelis | 99.7 /100 | #48 | Exceptional 10.3% |
| Immigrants | Spain | 99.7 /100 | #49 | Exceptional 10.3% |
| South Americans | 99.6 /100 | #50 | Exceptional 10.3% |
| Salvadorans | 99.6 /100 | #51 | Exceptional 10.4% |
| Immigrants | Saudi Arabia | 99.6 /100 | #52 | Exceptional 10.4% |
| Immigrants | Uzbekistan | 99.6 /100 | #53 | Exceptional 10.4% |
| Peruvians | 99.6 /100 | #54 | Exceptional 10.4% |
| Immigrants | Eritrea | 99.6 /100 | #55 | Exceptional 10.4% |
| Tongans | 99.6 /100 | #56 | Exceptional 10.4% |
| Immigrants | South America | 99.6 /100 | #57 | Exceptional 10.4% |
| Immigrants | Japan | 99.5 /100 | #58 | Exceptional 10.4% |
| Immigrants | Australia | 99.5 /100 | #59 | Exceptional 10.4% |
| Immigrants | Colombia | 99.5 /100 | #60 | Exceptional 10.4% |
| Immigrants | Northern Africa | 99.4 /100 | #61 | Exceptional 10.4% |
| Immigrants | Ecuador | 99.3 /100 | #62 | Exceptional 10.4% |