Malaysian vs Immigrants from Indonesia Male Disability
COMPARE
Malaysian
Immigrants from Indonesia
Male Disability
Male Disability Comparison
Malaysians
Immigrants from Indonesia
11.8%
MALE DISABILITY
1.8/ 100
METRIC RATING
232nd/ 347
METRIC RANK
10.2%
MALE DISABILITY
99.8/ 100
METRIC RATING
37th/ 347
METRIC RANK
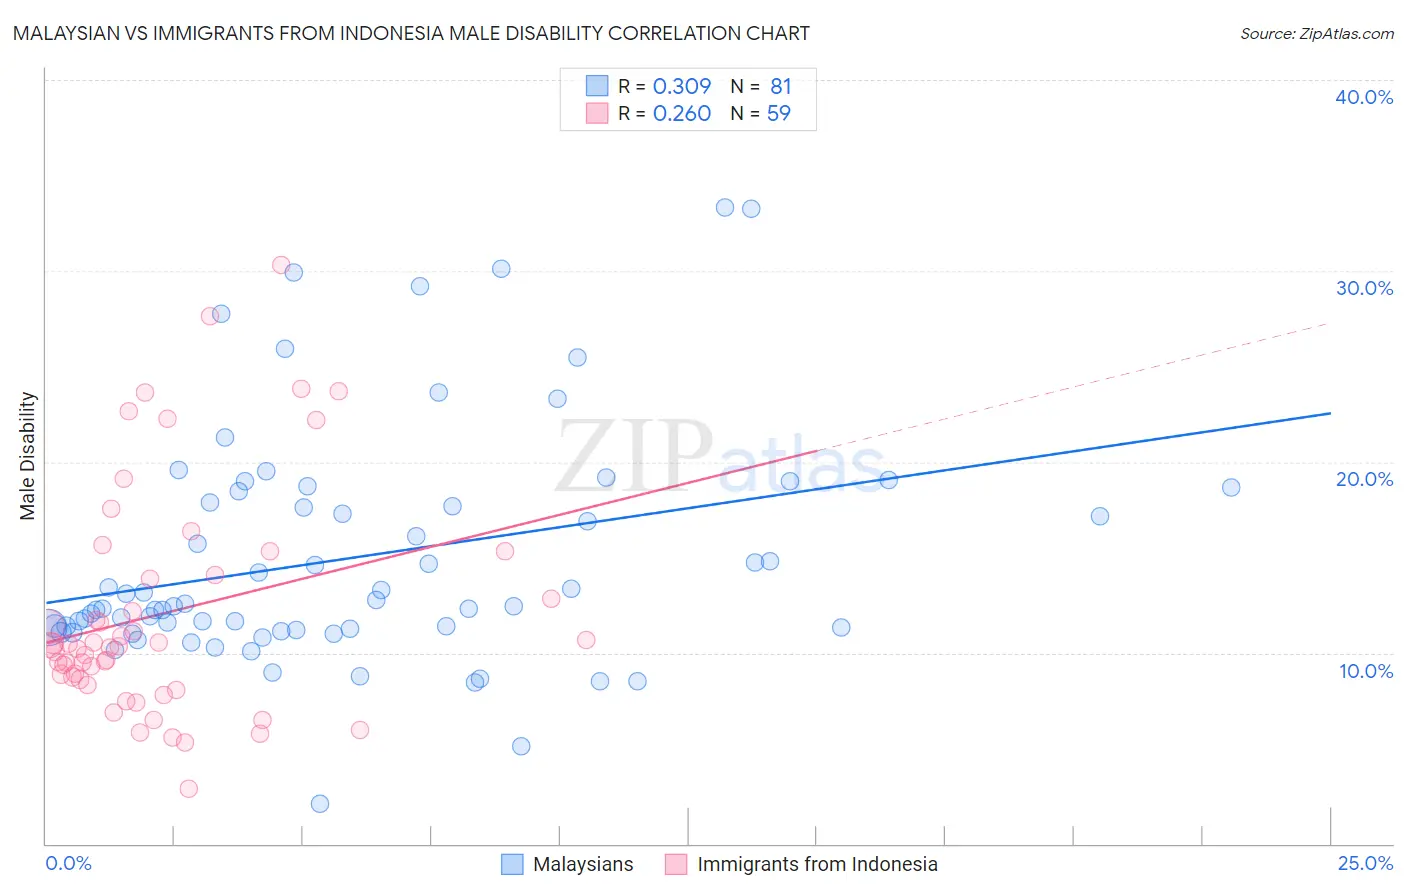
Malaysian vs Immigrants from Indonesia Male Disability Correlation Chart
The statistical analysis conducted on geographies consisting of 226,062,465 people shows a mild positive correlation between the proportion of Malaysians and percentage of males with a disability in the United States with a correlation coefficient (R) of 0.309 and weighted average of 11.8%. Similarly, the statistical analysis conducted on geographies consisting of 215,790,379 people shows a weak positive correlation between the proportion of Immigrants from Indonesia and percentage of males with a disability in the United States with a correlation coefficient (R) of 0.260 and weighted average of 10.2%, a difference of 15.9%.
Male Disability Correlation Summary
| Measurement | Malaysian | Immigrants from Indonesia |
| Minimum | 2.1% | 2.9% |
| Maximum | 33.3% | 30.3% |
| Range | 31.3% | 27.4% |
| Mean | 15.0% | 12.0% |
| Median | 12.5% | 10.4% |
| Interquartile 25% (IQ1) | 11.2% | 8.6% |
| Interquartile 75% (IQ3) | 18.2% | 14.0% |
| Interquartile Range (IQR) | 6.9% | 5.4% |
| Standard Deviation (Sample) | 6.2% | 5.9% |
| Standard Deviation (Population) | 6.1% | 5.9% |
Similar Demographics by Male Disability
Demographics Similar to Malaysians by Male Disability
In terms of male disability, the demographic groups most similar to Malaysians are Mexican (11.8%, a difference of 0.040%), Dominican (11.8%, a difference of 0.060%), Immigrants from Canada (11.9%, a difference of 0.11%), Immigrants from North America (11.9%, a difference of 0.24%), and Croatian (11.8%, a difference of 0.26%).
| Demographics | Rating | Rank | Male Disability |
| Liberians | 3.1 /100 | #225 | Tragic 11.8% |
| Sub-Saharan Africans | 2.8 /100 | #226 | Tragic 11.8% |
| Austrians | 2.5 /100 | #227 | Tragic 11.8% |
| Hispanics or Latinos | 2.3 /100 | #228 | Tragic 11.8% |
| Bermudans | 2.3 /100 | #229 | Tragic 11.8% |
| Croatians | 2.1 /100 | #230 | Tragic 11.8% |
| Dominicans | 1.8 /100 | #231 | Tragic 11.8% |
| Malaysians | 1.8 /100 | #232 | Tragic 11.8% |
| Mexicans | 1.7 /100 | #233 | Tragic 11.8% |
| Immigrants | Canada | 1.6 /100 | #234 | Tragic 11.9% |
| Immigrants | North America | 1.5 /100 | #235 | Tragic 11.9% |
| U.S. Virgin Islanders | 1.3 /100 | #236 | Tragic 11.9% |
| Carpatho Rusyns | 1.3 /100 | #237 | Tragic 11.9% |
| Yugoslavians | 1.2 /100 | #238 | Tragic 11.9% |
| Italians | 1.2 /100 | #239 | Tragic 11.9% |
Demographics Similar to Immigrants from Indonesia by Male Disability
In terms of male disability, the demographic groups most similar to Immigrants from Indonesia are Ethiopian (10.2%, a difference of 0.070%), Immigrants from Argentina (10.2%, a difference of 0.12%), Immigrants from Kuwait (10.2%, a difference of 0.17%), Immigrants from Turkey (10.2%, a difference of 0.24%), and Immigrants from Ethiopia (10.2%, a difference of 0.30%).
| Demographics | Rating | Rank | Male Disability |
| Immigrants | Egypt | 99.9 /100 | #30 | Exceptional 10.1% |
| Soviet Union | 99.9 /100 | #31 | Exceptional 10.1% |
| Argentineans | 99.9 /100 | #32 | Exceptional 10.1% |
| Immigrants | Ethiopia | 99.9 /100 | #33 | Exceptional 10.2% |
| Immigrants | Turkey | 99.9 /100 | #34 | Exceptional 10.2% |
| Immigrants | Argentina | 99.9 /100 | #35 | Exceptional 10.2% |
| Ethiopians | 99.8 /100 | #36 | Exceptional 10.2% |
| Immigrants | Indonesia | 99.8 /100 | #37 | Exceptional 10.2% |
| Immigrants | Kuwait | 99.8 /100 | #38 | Exceptional 10.2% |
| Afghans | 99.8 /100 | #39 | Exceptional 10.2% |
| Immigrants | Nepal | 99.8 /100 | #40 | Exceptional 10.3% |
| Taiwanese | 99.8 /100 | #41 | Exceptional 10.3% |
| Mongolians | 99.7 /100 | #42 | Exceptional 10.3% |
| Immigrants | Bangladesh | 99.7 /100 | #43 | Exceptional 10.3% |
| Immigrants | El Salvador | 99.7 /100 | #44 | Exceptional 10.3% |