Immigrants vs African Female Disability
COMPARE
Immigrants
African
Female Disability
Female Disability Comparison
Immigrants
Africans
11.7%
FEMALE DISABILITY
98.1/ 100
METRIC RATING
109th/ 347
METRIC RANK
13.4%
FEMALE DISABILITY
0.0/ 100
METRIC RATING
301st/ 347
METRIC RANK
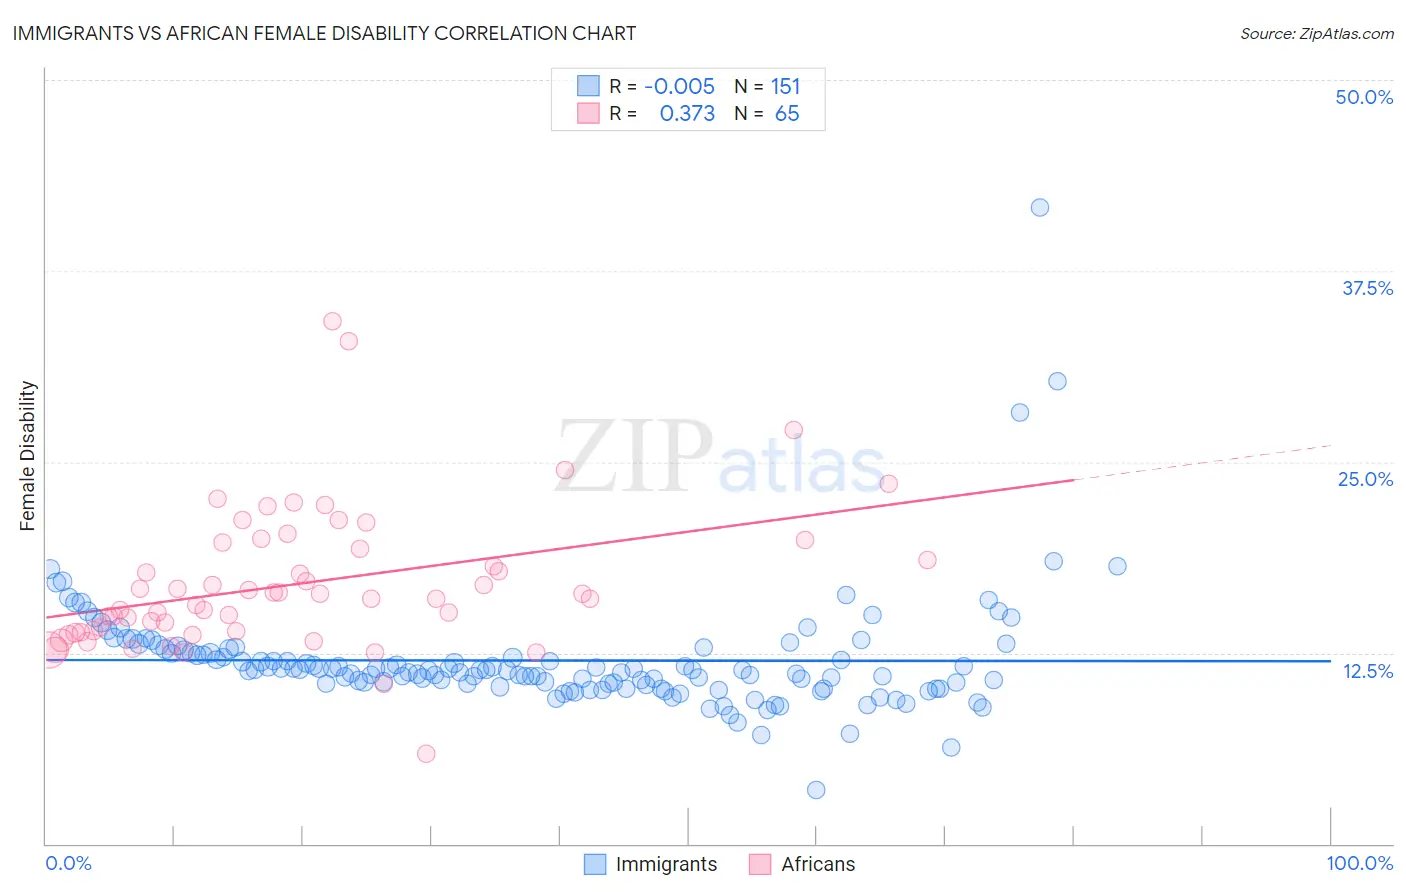
Immigrants vs African Female Disability Correlation Chart
The statistical analysis conducted on geographies consisting of 577,392,007 people shows no correlation between the proportion of Immigrants and percentage of females with a disability in the United States with a correlation coefficient (R) of -0.005 and weighted average of 11.7%. Similarly, the statistical analysis conducted on geographies consisting of 469,943,278 people shows a mild positive correlation between the proportion of Africans and percentage of females with a disability in the United States with a correlation coefficient (R) of 0.373 and weighted average of 13.4%, a difference of 14.4%.
Female Disability Correlation Summary
| Measurement | Immigrants | African |
| Minimum | 3.5% | 5.9% |
| Maximum | 41.7% | 34.2% |
| Range | 38.2% | 28.4% |
| Mean | 12.0% | 17.0% |
| Median | 11.4% | 16.1% |
| Interquartile 25% (IQ1) | 10.4% | 13.9% |
| Interquartile 75% (IQ3) | 12.7% | 19.5% |
| Interquartile Range (IQR) | 2.2% | 5.6% |
| Standard Deviation (Sample) | 3.9% | 4.7% |
| Standard Deviation (Population) | 3.8% | 4.7% |
Similar Demographics by Female Disability
Demographics Similar to Immigrants by Female Disability
In terms of female disability, the demographic groups most similar to Immigrants are Soviet Union (11.7%, a difference of 0.0%), Costa Rican (11.7%, a difference of 0.020%), New Zealander (11.7%, a difference of 0.030%), Latvian (11.7%, a difference of 0.050%), and Immigrants from Greece (11.7%, a difference of 0.080%).
| Demographics | Rating | Rank | Female Disability |
| Immigrants | South Eastern Asia | 98.4 /100 | #102 | Exceptional 11.7% |
| Immigrants | Eastern Africa | 98.3 /100 | #103 | Exceptional 11.7% |
| Immigrants | Western Asia | 98.3 /100 | #104 | Exceptional 11.7% |
| Australians | 98.3 /100 | #105 | Exceptional 11.7% |
| Immigrants | Greece | 98.2 /100 | #106 | Exceptional 11.7% |
| Latvians | 98.2 /100 | #107 | Exceptional 11.7% |
| New Zealanders | 98.1 /100 | #108 | Exceptional 11.7% |
| Immigrants | Immigrants | 98.1 /100 | #109 | Exceptional 11.7% |
| Soviet Union | 98.1 /100 | #110 | Exceptional 11.7% |
| Costa Ricans | 98.1 /100 | #111 | Exceptional 11.7% |
| Immigrants | Bangladesh | 97.8 /100 | #112 | Exceptional 11.8% |
| Immigrants | Belarus | 97.8 /100 | #113 | Exceptional 11.8% |
| South Africans | 97.7 /100 | #114 | Exceptional 11.8% |
| Brazilians | 97.7 /100 | #115 | Exceptional 11.8% |
| Immigrants | Morocco | 97.6 /100 | #116 | Exceptional 11.8% |
Demographics Similar to Africans by Female Disability
In terms of female disability, the demographic groups most similar to Africans are Scotch-Irish (13.4%, a difference of 0.14%), Immigrants from Portugal (13.5%, a difference of 0.14%), Immigrants from Micronesia (13.5%, a difference of 0.17%), Pennsylvania German (13.4%, a difference of 0.20%), and Immigrants from Dominican Republic (13.4%, a difference of 0.21%).
| Demographics | Rating | Rank | Female Disability |
| Celtics | 0.0 /100 | #294 | Tragic 13.3% |
| French | 0.0 /100 | #295 | Tragic 13.3% |
| Nepalese | 0.0 /100 | #296 | Tragic 13.3% |
| Slovaks | 0.0 /100 | #297 | Tragic 13.3% |
| Immigrants | Nonimmigrants | 0.0 /100 | #298 | Tragic 13.4% |
| Immigrants | Dominican Republic | 0.0 /100 | #299 | Tragic 13.4% |
| Pennsylvania Germans | 0.0 /100 | #300 | Tragic 13.4% |
| Africans | 0.0 /100 | #301 | Tragic 13.4% |
| Scotch-Irish | 0.0 /100 | #302 | Tragic 13.4% |
| Immigrants | Portugal | 0.0 /100 | #303 | Tragic 13.5% |
| Immigrants | Micronesia | 0.0 /100 | #304 | Tragic 13.5% |
| Dominicans | 0.0 /100 | #305 | Tragic 13.5% |
| French Canadians | 0.0 /100 | #306 | Tragic 13.6% |
| Central American Indians | 0.0 /100 | #307 | Tragic 13.6% |
| Cree | 0.0 /100 | #308 | Tragic 13.7% |