Immigrants from Turkey vs Yuman Female Disability
COMPARE
Immigrants from Turkey
Yuman
Female Disability
Female Disability Comparison
Immigrants from Turkey
Yuman
11.1%
FEMALE DISABILITY
100.0/ 100
METRIC RATING
27th/ 347
METRIC RANK
14.5%
FEMALE DISABILITY
0.0/ 100
METRIC RATING
330th/ 347
METRIC RANK
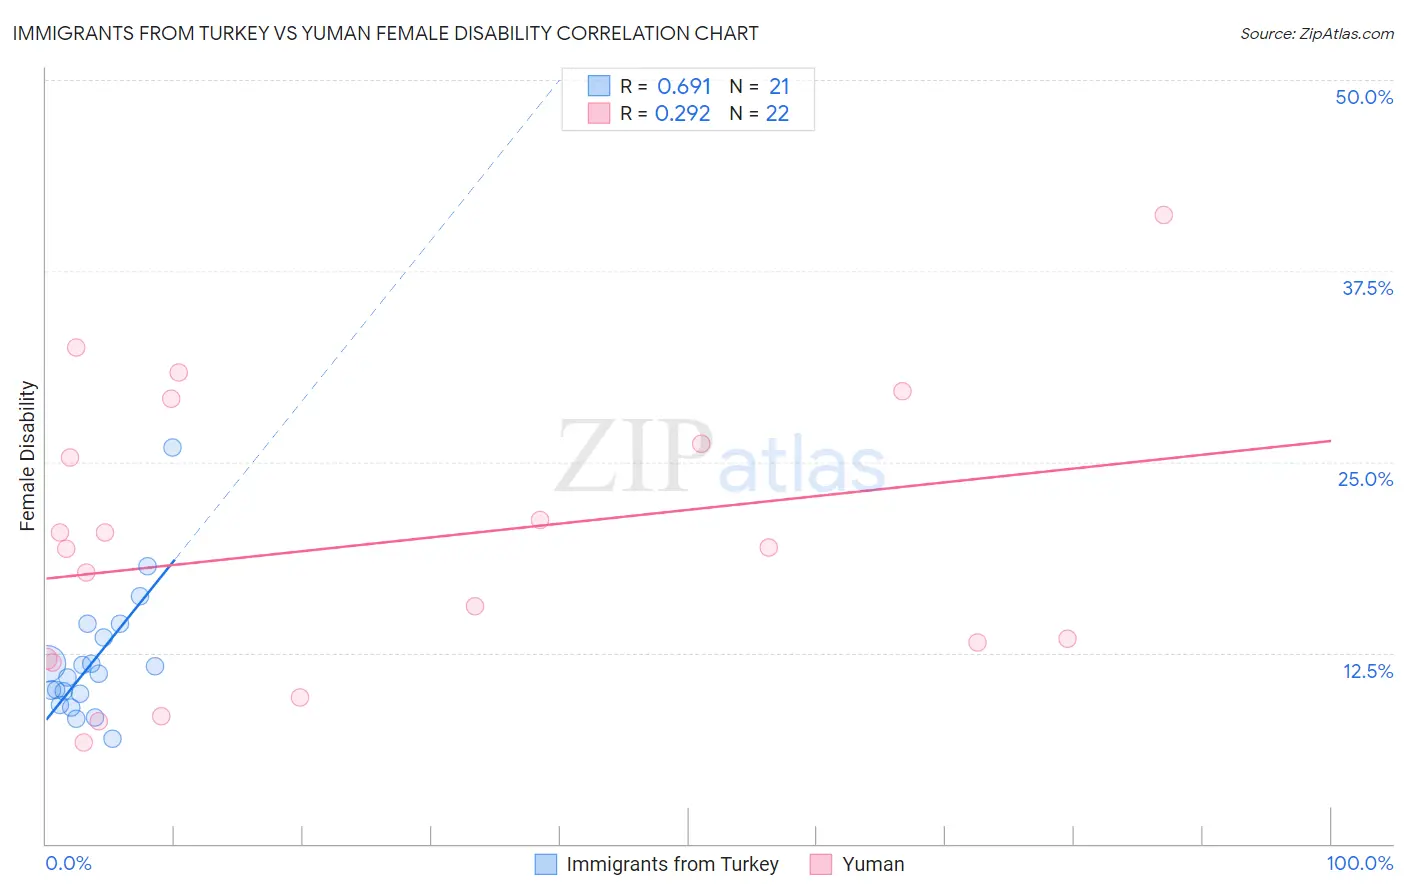
Immigrants from Turkey vs Yuman Female Disability Correlation Chart
The statistical analysis conducted on geographies consisting of 223,044,137 people shows a significant positive correlation between the proportion of Immigrants from Turkey and percentage of females with a disability in the United States with a correlation coefficient (R) of 0.691 and weighted average of 11.1%. Similarly, the statistical analysis conducted on geographies consisting of 40,663,029 people shows a weak positive correlation between the proportion of Yuman and percentage of females with a disability in the United States with a correlation coefficient (R) of 0.292 and weighted average of 14.5%, a difference of 31.0%.
Female Disability Correlation Summary
| Measurement | Immigrants from Turkey | Yuman |
| Minimum | 6.9% | 6.6% |
| Maximum | 25.9% | 41.2% |
| Range | 19.0% | 34.6% |
| Mean | 12.0% | 19.6% |
| Median | 11.2% | 19.4% |
| Interquartile 25% (IQ1) | 9.5% | 12.1% |
| Interquartile 75% (IQ3) | 13.9% | 26.2% |
| Interquartile Range (IQR) | 4.5% | 14.0% |
| Standard Deviation (Sample) | 4.2% | 9.2% |
| Standard Deviation (Population) | 4.1% | 9.0% |
Similar Demographics by Female Disability
Demographics Similar to Immigrants from Turkey by Female Disability
In terms of female disability, the demographic groups most similar to Immigrants from Turkey are Egyptian (11.1%, a difference of 0.27%), Immigrants from Malaysia (11.1%, a difference of 0.34%), Turkish (11.1%, a difference of 0.34%), Argentinean (11.0%, a difference of 0.40%), and Immigrants from Asia (11.0%, a difference of 0.44%).
| Demographics | Rating | Rank | Female Disability |
| Immigrants | Pakistan | 100.0 /100 | #20 | Exceptional 10.9% |
| Asians | 100.0 /100 | #21 | Exceptional 10.9% |
| Immigrants | Sri Lanka | 100.0 /100 | #22 | Exceptional 10.9% |
| Venezuelans | 100.0 /100 | #23 | Exceptional 11.0% |
| Immigrants | Argentina | 100.0 /100 | #24 | Exceptional 11.0% |
| Immigrants | Asia | 100.0 /100 | #25 | Exceptional 11.0% |
| Argentineans | 100.0 /100 | #26 | Exceptional 11.0% |
| Immigrants | Turkey | 100.0 /100 | #27 | Exceptional 11.1% |
| Egyptians | 100.0 /100 | #28 | Exceptional 11.1% |
| Immigrants | Malaysia | 100.0 /100 | #29 | Exceptional 11.1% |
| Turks | 100.0 /100 | #30 | Exceptional 11.1% |
| Immigrants | Kuwait | 100.0 /100 | #31 | Exceptional 11.1% |
| Immigrants | Australia | 100.0 /100 | #32 | Exceptional 11.1% |
| Immigrants | Egypt | 100.0 /100 | #33 | Exceptional 11.1% |
| Immigrants | Indonesia | 100.0 /100 | #34 | Exceptional 11.2% |
Demographics Similar to Yuman by Female Disability
In terms of female disability, the demographic groups most similar to Yuman are Immigrants from Cabo Verde (14.6%, a difference of 0.42%), Osage (14.3%, a difference of 1.4%), Ottawa (14.2%, a difference of 1.8%), Cape Verdean (14.2%, a difference of 1.8%), and Pima (14.8%, a difference of 2.0%).
| Demographics | Rating | Rank | Female Disability |
| Blacks/African Americans | 0.0 /100 | #323 | Tragic 14.1% |
| Natives/Alaskans | 0.0 /100 | #324 | Tragic 14.1% |
| Navajo | 0.0 /100 | #325 | Tragic 14.2% |
| Comanche | 0.0 /100 | #326 | Tragic 14.2% |
| Ottawa | 0.0 /100 | #327 | Tragic 14.2% |
| Cape Verdeans | 0.0 /100 | #328 | Tragic 14.2% |
| Osage | 0.0 /100 | #329 | Tragic 14.3% |
| Yuman | 0.0 /100 | #330 | Tragic 14.5% |
| Immigrants | Cabo Verde | 0.0 /100 | #331 | Tragic 14.6% |
| Pima | 0.0 /100 | #332 | Tragic 14.8% |
| Immigrants | Azores | 0.0 /100 | #333 | Tragic 14.9% |
| Cherokee | 0.0 /100 | #334 | Tragic 14.9% |
| Cajuns | 0.0 /100 | #335 | Tragic 14.9% |
| Seminole | 0.0 /100 | #336 | Tragic 15.0% |
| Tohono O'odham | 0.0 /100 | #337 | Tragic 15.0% |