Immigrants from Singapore vs Haitian Male Disability

COMPARE

Immigrants from Singapore
Race
Ancestry
AfghanAfricanAlaska NativeAlaskan AthabascanAlbanianAleutAlsatianAmericanApacheArabArapahoArgentineanArmenianAssyrian/Chaldean/SyriacAustralianAustrianBahamianBangladeshiBarbadianBasqueBelgianBelizeanBermudanBhutaneseBlackfeetBolivianBrazilianBritishBritish West IndianBulgarianBurmeseCajunCambodianCanadianCape VerdeanCarpatho RusynCelticCentral AmericanCentral American IndianCherokeeCheyenneChickasawChileanChineseChippewaChoctawColombianColvilleComancheCosta RicanCreeCreekCroatianCrowCubanCypriotCzechCzechoslovakianDanishDelawareDominicanDutchDutch West IndianEastern EuropeanEcuadorianEgyptianEnglishEstonianEthiopianEuropeanFijianFilipinoFinnishFrenchFrench American IndianFrench CanadianGermanGerman RussianGhanaianGreekGuamanian/ChamorroGuatemalanGuyaneseHmongHonduranHopiHoumaHungarianIcelanderIndian (Asian)IndonesianInupiatIranianIraqiIrishIroquoisIsraeliItalianJamaicanJapaneseJordanianKenyanKiowaKoreanLaotianLatvianLebaneseLiberianLithuanianLumbeeLuxembourgerMacedonianMalaysianMalteseMarshalleseMenomineeMexicanMexican American IndianMongolianMoroccanNative HawaiianNavajoNepaleseNew ZealanderNicaraguanNigerianNorthern EuropeanNorwegianOkinawanOsageOttawaPaiutePakistaniPalestinianPanamanianParaguayanPennsylvania GermanPeruvianPimaPolishPortuguesePotawatomiPuebloPuerto RicanPuget Sound SalishRomanianRussianSalvadoranSamoanScandinavianScotch-IrishScottishSeminoleSenegaleseSerbianShoshoneSierra LeoneanSiouxSlavicSlovakSloveneSomaliSouth AfricanSouth AmericanSouth American IndianSoviet UnionSpaniardSpanishSpanish AmericanSpanish American IndianSri LankanSubsaharan AfricanSudaneseSwedishSwissSyrianTaiwaneseThaiTlingit-HaidaTohono O'OdhamTonganTrinidadian and TobagonianTsimshianTurkishU.S. Virgin IslanderUgandanUkrainianUruguayanUteVenezuelanVietnameseWelshWest IndianYakamaYaquiYugoslavianYumanYup'ikZimbabwean
Immigration
NonimmigrantsImmigrantsAfghanistanAfricaAlbaniaArgentinaArmeniaAsiaAustraliaAustriaBahamasBangladeshBarbadosBelarusBelgiumBelizeBoliviaBosnia and HerzegovinaBrazilBulgariaBurma/MyanmarCabo VerdeCambodiaCameroonCanadaCaribbeanCentral AmericaChileChinaColombiaCongoCosta RicaCroatiaCubaCzechoslovakiaDenmarkDominicaDominican RepublicEastern AfricaEastern AsiaEastern EuropeEcuadorEgyptEl SalvadorEnglandEritreaEthiopiaEuropeFijiFranceGermanyGhanaGreeceGrenadaGuatemalaGuyanaHaitiHondurasHong KongHungaryIndiaIndonesiaIranIraqIrelandIsraelItalyJamaicaJapanJordanKazakhstanKenyaKoreaKuwaitLaosLatin AmericaLatviaLebanonLiberiaLithuaniaMalaysiaMexicoMicronesiaMiddle AfricaMoldovaMoroccoNepalNetherlandsNicaraguaNigeriaNorth AmericaNorth MacedoniaNorthern AfricaNorthern EuropeNorwayOceaniaPakistanPanamaPeruPhilippinesPolandPortugalRomaniaRussiaSaudi ArabiaScotlandSenegalSerbiaSierra LeoneSingaporeSomaliaSouth AfricaSouth AmericaSouth Central AsiaSouth Eastern AsiaSouthern EuropeSpainSri LankaSt. Vincent and the GrenadinesSudanSwedenSwitzerlandSyriaTaiwanThailandTrinidad and TobagoTurkeyUgandaUkraineUruguayUzbekistanVenezuelaVietnamWest IndiesWestern AfricaWestern AsiaWestern EuropeYemenZaireZimbabweAzores
Haitian
Race
Ancestry
AfghanAfricanAlaska NativeAlaskan AthabascanAlbanianAleutAlsatianAmericanApacheArabArapahoArgentineanArmenianAssyrian/Chaldean/SyriacAustralianAustrianBahamianBangladeshiBarbadianBasqueBelgianBelizeanBermudanBhutaneseBlackfeetBolivianBrazilianBritishBritish West IndianBulgarianBurmeseCajunCambodianCanadianCape VerdeanCarpatho RusynCelticCentral AmericanCentral American IndianCherokeeCheyenneChickasawChileanChineseChippewaChoctawColombianColvilleComancheCosta RicanCreeCreekCroatianCrowCubanCypriotCzechCzechoslovakianDanishDelawareDominicanDutchDutch West IndianEastern EuropeanEcuadorianEgyptianEnglishEstonianEthiopianEuropeanFijianFilipinoFinnishFrenchFrench American IndianFrench CanadianGermanGerman RussianGhanaianGreekGuamanian/ChamorroGuatemalanGuyaneseHaitianHmongHonduranHopiHoumaHungarianIcelanderIndian (Asian)IndonesianInupiatIranianIraqiIrishIroquoisIsraeliItalianJamaicanJapaneseJordanianKenyanKiowaKoreanLaotianLatvianLebaneseLiberianLithuanianLumbeeLuxembourgerMacedonianMalaysianMalteseMarshalleseMenomineeMexicanMexican American IndianMongolianMoroccanNative HawaiianNavajoNepaleseNew ZealanderNicaraguanNigerianNorthern EuropeanNorwegianOkinawanOsageOttawaPaiutePakistaniPalestinianPanamanianParaguayanPennsylvania GermanPeruvianPimaPolishPortuguesePotawatomiPuebloPuerto RicanPuget Sound SalishRomanianRussianSalvadoranSamoanScandinavianScotch-IrishScottishSeminoleSenegaleseSerbianShoshoneSierra LeoneanSiouxSlavicSlovakSloveneSomaliSouth AfricanSouth AmericanSouth American IndianSoviet UnionSpaniardSpanishSpanish AmericanSpanish American IndianSri LankanSubsaharan AfricanSudaneseSwedishSwissSyrianTaiwaneseThaiTlingit-HaidaTohono O'OdhamTonganTrinidadian and TobagonianTsimshianTurkishU.S. Virgin IslanderUgandanUkrainianUruguayanUteVenezuelanVietnameseWelshWest IndianYakamaYaquiYugoslavianYumanYup'ikZimbabwean
Immigration
NonimmigrantsImmigrantsAfghanistanAfricaAlbaniaArgentinaArmeniaAsiaAustraliaAustriaBahamasBangladeshBarbadosBelarusBelgiumBelizeBoliviaBosnia and HerzegovinaBrazilBulgariaBurma/MyanmarCabo VerdeCambodiaCameroonCanadaCaribbeanCentral AmericaChileChinaColombiaCongoCosta RicaCroatiaCubaCzechoslovakiaDenmarkDominicaDominican RepublicEastern AfricaEastern AsiaEastern EuropeEcuadorEgyptEl SalvadorEnglandEritreaEthiopiaEuropeFijiFranceGermanyGhanaGreeceGrenadaGuatemalaGuyanaHaitiHondurasHong KongHungaryIndiaIndonesiaIranIraqIrelandIsraelItalyJamaicaJapanJordanKazakhstanKenyaKoreaKuwaitLaosLatin AmericaLatviaLebanonLiberiaLithuaniaMalaysiaMexicoMicronesiaMiddle AfricaMoldovaMoroccoNepalNetherlandsNicaraguaNigeriaNorth AmericaNorth MacedoniaNorthern AfricaNorthern EuropeNorwayOceaniaPakistanPanamaPeruPhilippinesPolandPortugalRomaniaRussiaSaudi ArabiaScotlandSenegalSerbiaSierra LeoneSomaliaSouth AfricaSouth AmericaSouth Central AsiaSouth Eastern AsiaSouthern EuropeSpainSri LankaSt. Vincent and the GrenadinesSudanSwedenSwitzerlandSyriaTaiwanThailandTrinidad and TobagoTurkeyUgandaUkraineUruguayUzbekistanVenezuelaVietnamWest IndiesWestern AfricaWestern AsiaWestern EuropeYemenZaireZimbabweAzores
Male Disability
Income
Poverty
Unemployment
Labor Participation
Family Structure
Vehicle Availability
Education Level
Disability

Male Disability Comparison

Immigrants from Singapore

Haitians

Exceptional
Average
9.5%
MALE DISABILITY
100.0/ 100
METRIC RATING
9th/ 347
METRIC RANK
11.2%
MALE DISABILITY
52.5/ 100
METRIC RATING
171st/ 347
METRIC RANK

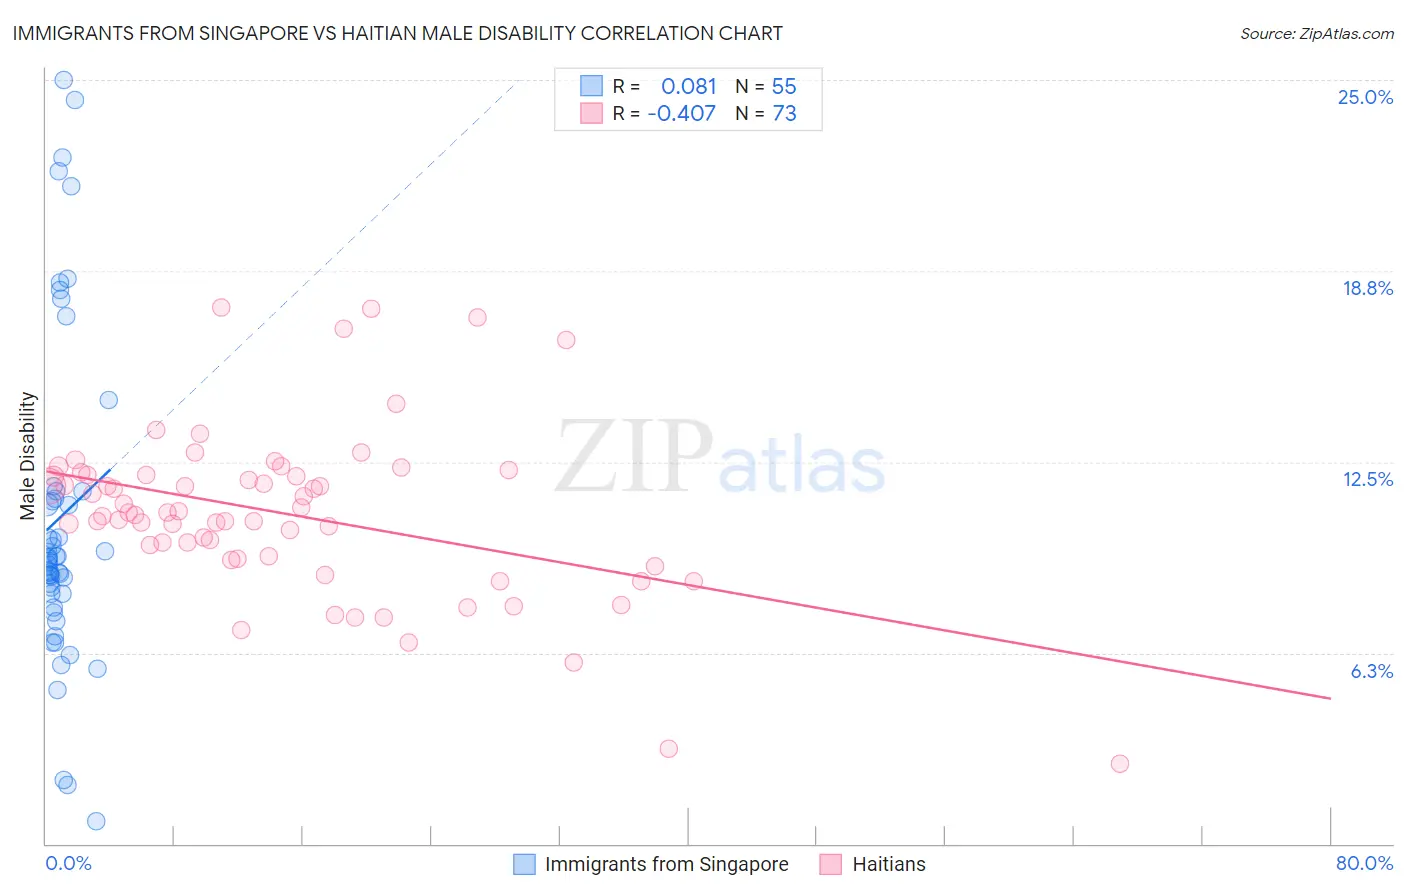
Immigrants from Singapore vs Haitian Male Disability Correlation Chart

The statistical analysis conducted on geographies consisting of 137,518,836 people shows a slight positive correlation between the proportion of Immigrants from Singapore and percentage of males with a disability in the United States with a correlation coefficient (R) of 0.081 and weighted average of 9.5%. Similarly, the statistical analysis conducted on geographies consisting of 287,906,859 people shows a moderate negative correlation between the proportion of Haitians and percentage of males with a disability in the United States with a correlation coefficient (R) of -0.407 and weighted average of 11.2%, a difference of 17.6%.
Immigrants from Singapore vs Haitian Male Disability

Male Disability Correlation Summary

MeasurementImmigrants from SingaporeHaitian
Minimum0.75%2.6%
Maximum25.0%17.5%
Range24.2%14.9%
Mean10.7%10.8%
Median9.3%10.8%
Interquartile 25% (IQ1)8.2%9.4%
Interquartile 75% (IQ3)11.5%12.1%
Interquartile Range (IQR)3.4%2.7%
Standard Deviation (Sample)5.4%2.8%
Standard Deviation (Population)5.3%2.7%

Similar Demographics by Male Disability

Demographics Similar to Immigrants from Singapore by Male Disability

In terms of male disability, the demographic groups most similar to Immigrants from Singapore are Immigrants from China (9.5%, a difference of 0.080%), Immigrants from Israel (9.6%, a difference of 0.43%), Immigrants from Bolivia (9.5%, a difference of 0.68%), Immigrants from Eastern Asia (9.6%, a difference of 0.98%), and Immigrants from South Central Asia (9.4%, a difference of 1.0%).
DemographicsRating | RankMale Disability
Immigrants | Taiwan
100.0
/100
|
#2
Exceptional
9.1%
Filipinos
100.0
/100
|
#3
Exceptional
9.1%
Thais
100.0
/100
|
#4
Exceptional
9.2%
Immigrants | Hong Kong
100.0
/100
|
#5
Exceptional
9.4%
Immigrants | South Central Asia
100.0
/100
|
#6
Exceptional
9.4%
Immigrants | Bolivia
100.0
/100
|
#7
Exceptional
9.5%
Immigrants | China
100.0
/100
|
#8
Exceptional
9.5%
Immigrants | Singapore
100.0
/100
|
#9
Exceptional
9.5%
Immigrants | Israel
100.0
/100
|
#10
Exceptional
9.6%
Immigrants | Eastern Asia
100.0
/100
|
#11
Exceptional
9.6%
Bolivians
100.0
/100
|
#12
Exceptional
9.6%
Iranians
100.0
/100
|
#13
Exceptional
9.7%
Immigrants | Iran
100.0
/100
|
#14
Exceptional
9.7%
Indians (Asian)
100.0
/100
|
#15
Exceptional
9.7%
Okinawans
100.0
/100
|
#16
Exceptional
9.8%

Demographics Similar to Haitians by Male Disability

In terms of male disability, the demographic groups most similar to Haitians are New Zealander (11.2%, a difference of 0.020%), Barbadian (11.2%, a difference of 0.050%), Immigrants from Latin America (11.2%, a difference of 0.080%), Immigrants from Southern Europe (11.2%, a difference of 0.10%), and Romanian (11.2%, a difference of 0.10%).
DemographicsRating | RankMale Disability
British West Indians
62.8
/100
|
#164
Good
11.1%
Luxembourgers
61.9
/100
|
#165
Good
11.1%
Immigrants | Hungary
61.2
/100
|
#166
Good
11.1%
Immigrants | Southern Europe
54.4
/100
|
#167
Average
11.2%
Immigrants | Latin America
54.0
/100
|
#168
Average
11.2%
Barbadians
53.4
/100
|
#169
Average
11.2%
New Zealanders
52.9
/100
|
#170
Average
11.2%
Haitians
52.5
/100
|
#171
Average
11.2%
Romanians
50.7
/100
|
#172
Average
11.2%
Immigrants | Burma/Myanmar
50.4
/100
|
#173
Average
11.2%
Maltese
50.0
/100
|
#174
Average
11.2%
Immigrants | Honduras
48.7
/100
|
#175
Average
11.2%
Syrians
46.6
/100
|
#176
Average
11.2%
Immigrants | Norway
44.2
/100
|
#177
Average
11.3%
Australians
42.2
/100
|
#178
Average
11.3%