Immigrants from Peru vs Salvadoran Female Disability
COMPARE
Immigrants from Peru
Salvadoran
Female Disability
Female Disability Comparison
Immigrants from Peru
Salvadorans
11.3%
FEMALE DISABILITY
99.9/ 100
METRIC RATING
52nd/ 347
METRIC RANK
11.5%
FEMALE DISABILITY
99.8/ 100
METRIC RATING
66th/ 347
METRIC RANK
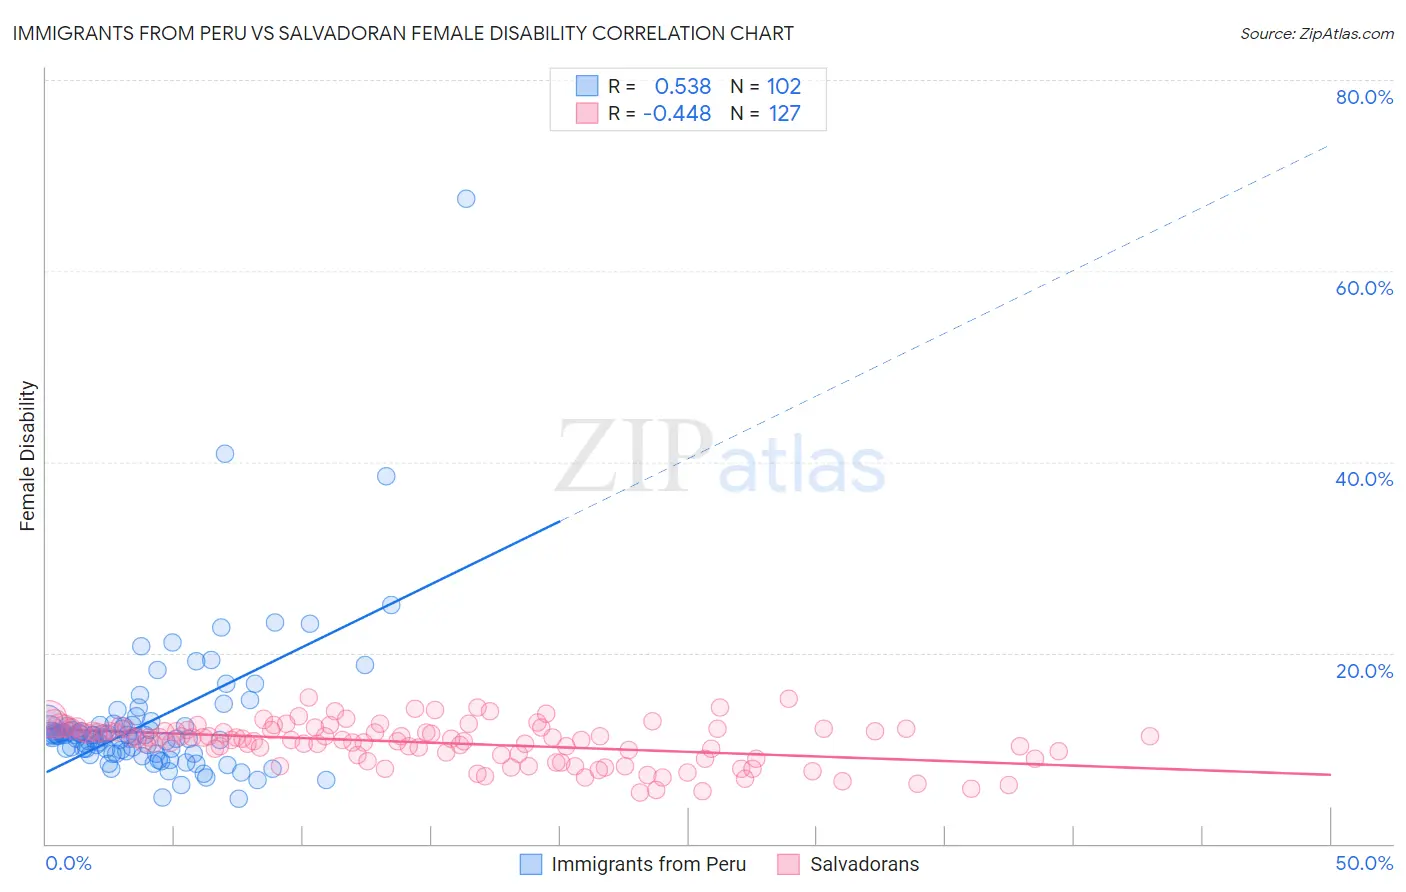
Immigrants from Peru vs Salvadoran Female Disability Correlation Chart
The statistical analysis conducted on geographies consisting of 328,825,833 people shows a substantial positive correlation between the proportion of Immigrants from Peru and percentage of females with a disability in the United States with a correlation coefficient (R) of 0.538 and weighted average of 11.3%. Similarly, the statistical analysis conducted on geographies consisting of 398,928,715 people shows a moderate negative correlation between the proportion of Salvadorans and percentage of females with a disability in the United States with a correlation coefficient (R) of -0.448 and weighted average of 11.5%, a difference of 1.2%.
Female Disability Correlation Summary
| Measurement | Immigrants from Peru | Salvadoran |
| Minimum | 4.7% | 5.3% |
| Maximum | 67.6% | 15.3% |
| Range | 62.9% | 9.9% |
| Mean | 12.8% | 10.6% |
| Median | 11.3% | 11.0% |
| Interquartile 25% (IQ1) | 9.6% | 9.3% |
| Interquartile 75% (IQ3) | 12.4% | 12.0% |
| Interquartile Range (IQR) | 2.8% | 2.8% |
| Standard Deviation (Sample) | 7.7% | 2.2% |
| Standard Deviation (Population) | 7.7% | 2.2% |
Demographics Similar to Immigrants from Peru and Salvadorans by Female Disability
In terms of female disability, the demographic groups most similar to Immigrants from Peru are Immigrants from Saudi Arabia (11.3%, a difference of 0.040%), Peruvian (11.3%, a difference of 0.10%), Immigrants from Belgium (11.3%, a difference of 0.12%), Bulgarian (11.3%, a difference of 0.12%), and Inupiat (11.3%, a difference of 0.20%). Similarly, the demographic groups most similar to Salvadorans are Immigrants from Vietnam (11.5%, a difference of 0.050%), Immigrants from Northern Africa (11.5%, a difference of 0.060%), Colombian (11.5%, a difference of 0.14%), Immigrants from South America (11.4%, a difference of 0.17%), and Immigrants from El Salvador (11.4%, a difference of 0.19%).
| Demographics | Rating | Rank | Female Disability |
| Tongans | 100.0 /100 | #49 | Exceptional 11.3% |
| Inupiat | 100.0 /100 | #50 | Exceptional 11.3% |
| Immigrants | Belgium | 100.0 /100 | #51 | Exceptional 11.3% |
| Immigrants | Peru | 99.9 /100 | #52 | Exceptional 11.3% |
| Immigrants | Saudi Arabia | 99.9 /100 | #53 | Exceptional 11.3% |
| Peruvians | 99.9 /100 | #54 | Exceptional 11.3% |
| Bulgarians | 99.9 /100 | #55 | Exceptional 11.3% |
| Taiwanese | 99.9 /100 | #56 | Exceptional 11.4% |
| South Americans | 99.9 /100 | #57 | Exceptional 11.4% |
| Laotians | 99.9 /100 | #58 | Exceptional 11.4% |
| Immigrants | Spain | 99.9 /100 | #59 | Exceptional 11.4% |
| Immigrants | Bulgaria | 99.9 /100 | #60 | Exceptional 11.4% |
| Immigrants | France | 99.9 /100 | #61 | Exceptional 11.4% |
| Sri Lankans | 99.9 /100 | #62 | Exceptional 11.4% |
| Immigrants | Colombia | 99.9 /100 | #63 | Exceptional 11.4% |
| Immigrants | El Salvador | 99.9 /100 | #64 | Exceptional 11.4% |
| Immigrants | South America | 99.9 /100 | #65 | Exceptional 11.4% |
| Salvadorans | 99.8 /100 | #66 | Exceptional 11.5% |
| Immigrants | Vietnam | 99.8 /100 | #67 | Exceptional 11.5% |
| Immigrants | Northern Africa | 99.8 /100 | #68 | Exceptional 11.5% |
| Colombians | 99.8 /100 | #69 | Exceptional 11.5% |