Immigrants from Oceania vs Belizean Cognitive Disability
COMPARE
Immigrants from Oceania
Belizean
Cognitive Disability
Cognitive Disability Comparison
Immigrants from Oceania
Belizeans
17.6%
COGNITIVE DISABILITY
7.3/ 100
METRIC RATING
212th/ 347
METRIC RANK
18.0%
COGNITIVE DISABILITY
0.4/ 100
METRIC RATING
266th/ 347
METRIC RANK
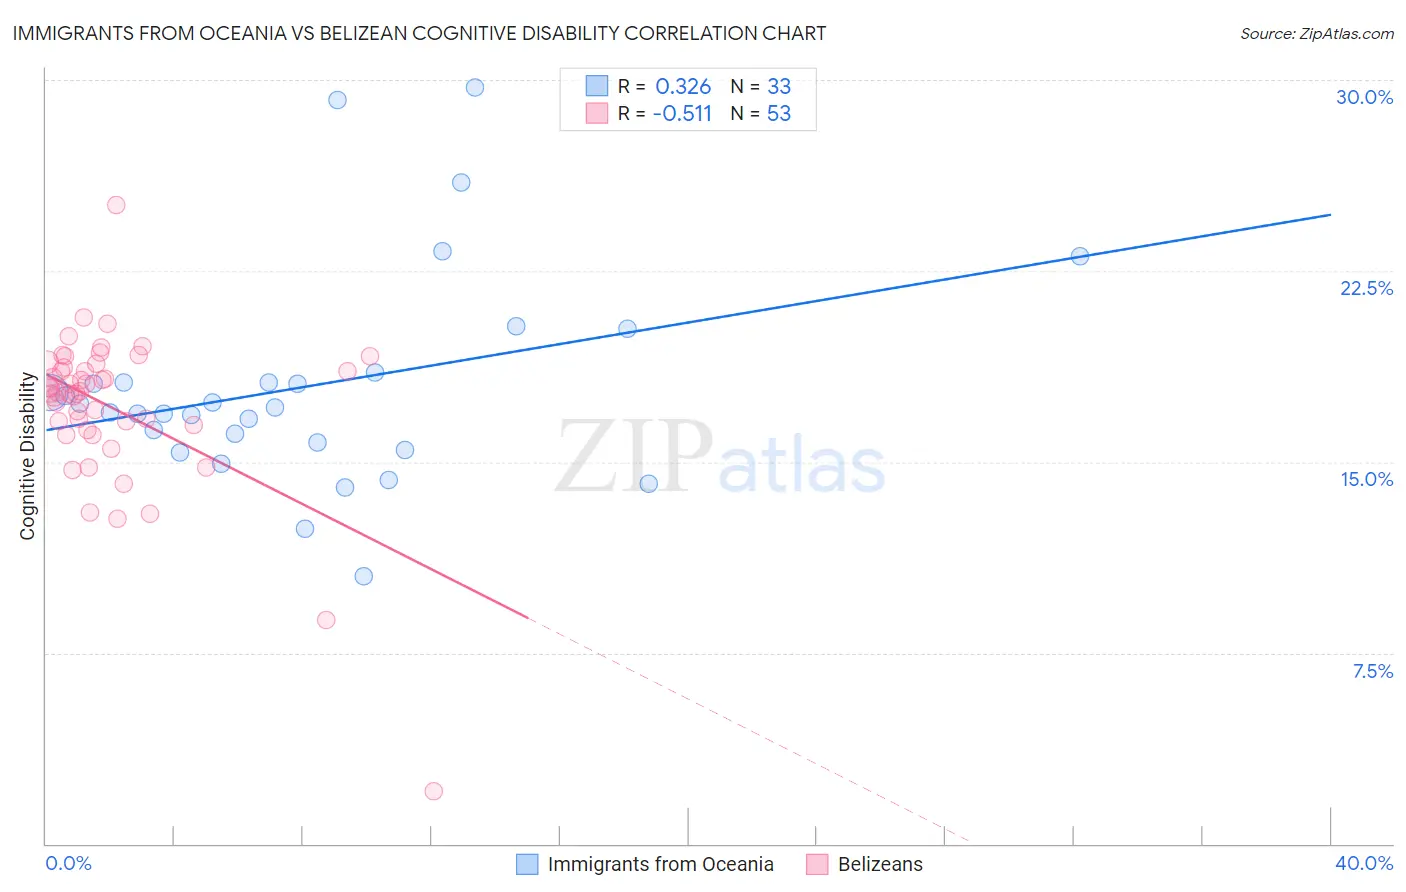
Immigrants from Oceania vs Belizean Cognitive Disability Correlation Chart
The statistical analysis conducted on geographies consisting of 305,496,536 people shows a mild positive correlation between the proportion of Immigrants from Oceania and percentage of population with cognitive disability in the United States with a correlation coefficient (R) of 0.326 and weighted average of 17.6%. Similarly, the statistical analysis conducted on geographies consisting of 144,188,092 people shows a substantial negative correlation between the proportion of Belizeans and percentage of population with cognitive disability in the United States with a correlation coefficient (R) of -0.511 and weighted average of 18.0%, a difference of 2.1%.
Cognitive Disability Correlation Summary
| Measurement | Immigrants from Oceania | Belizean |
| Minimum | 10.5% | 2.1% |
| Maximum | 29.7% | 25.1% |
| Range | 19.2% | 23.0% |
| Mean | 18.0% | 17.1% |
| Median | 17.1% | 17.7% |
| Interquartile 25% (IQ1) | 15.6% | 16.3% |
| Interquartile 75% (IQ3) | 18.3% | 18.8% |
| Interquartile Range (IQR) | 2.7% | 2.5% |
| Standard Deviation (Sample) | 4.2% | 3.2% |
| Standard Deviation (Population) | 4.1% | 3.2% |
Similar Demographics by Cognitive Disability
Demographics Similar to Immigrants from Oceania by Cognitive Disability
In terms of cognitive disability, the demographic groups most similar to Immigrants from Oceania are Hawaiian (17.6%, a difference of 0.010%), Taiwanese (17.6%, a difference of 0.040%), Immigrants from El Salvador (17.6%, a difference of 0.040%), Alaskan Athabascan (17.6%, a difference of 0.050%), and Okinawan (17.6%, a difference of 0.050%).
| Demographics | Rating | Rank | Cognitive Disability |
| Puget Sound Salish | 10.9 /100 | #205 | Poor 17.5% |
| Alaska Natives | 10.4 /100 | #206 | Poor 17.5% |
| Immigrants | Latin America | 9.7 /100 | #207 | Tragic 17.6% |
| Immigrants | Cameroon | 9.3 /100 | #208 | Tragic 17.6% |
| Immigrants | Trinidad and Tobago | 8.7 /100 | #209 | Tragic 17.6% |
| Immigrants | Jamaica | 8.5 /100 | #210 | Tragic 17.6% |
| Taiwanese | 7.7 /100 | #211 | Tragic 17.6% |
| Immigrants | Oceania | 7.3 /100 | #212 | Tragic 17.6% |
| Hawaiians | 7.2 /100 | #213 | Tragic 17.6% |
| Immigrants | El Salvador | 7.0 /100 | #214 | Tragic 17.6% |
| Alaskan Athabascans | 6.9 /100 | #215 | Tragic 17.6% |
| Okinawans | 6.8 /100 | #216 | Tragic 17.6% |
| Salvadorans | 6.7 /100 | #217 | Tragic 17.6% |
| Icelanders | 6.4 /100 | #218 | Tragic 17.6% |
| Immigrants | Sierra Leone | 6.3 /100 | #219 | Tragic 17.6% |
Demographics Similar to Belizeans by Cognitive Disability
In terms of cognitive disability, the demographic groups most similar to Belizeans are Spanish American (18.0%, a difference of 0.0%), Menominee (18.0%, a difference of 0.030%), Nepalese (18.0%, a difference of 0.060%), Cherokee (18.0%, a difference of 0.070%), and Immigrants from Barbados (17.9%, a difference of 0.090%).
| Demographics | Rating | Rank | Cognitive Disability |
| Ethiopians | 0.5 /100 | #259 | Tragic 17.9% |
| Immigrants | Belize | 0.5 /100 | #260 | Tragic 17.9% |
| Guamanians/Chamorros | 0.5 /100 | #261 | Tragic 17.9% |
| Sierra Leoneans | 0.4 /100 | #262 | Tragic 17.9% |
| Immigrants | Barbados | 0.4 /100 | #263 | Tragic 17.9% |
| Menominee | 0.4 /100 | #264 | Tragic 18.0% |
| Spanish Americans | 0.4 /100 | #265 | Tragic 18.0% |
| Belizeans | 0.4 /100 | #266 | Tragic 18.0% |
| Nepalese | 0.3 /100 | #267 | Tragic 18.0% |
| Cherokee | 0.3 /100 | #268 | Tragic 18.0% |
| Hondurans | 0.3 /100 | #269 | Tragic 18.0% |
| Immigrants | Bahamas | 0.3 /100 | #270 | Tragic 18.0% |
| Potawatomi | 0.2 /100 | #271 | Tragic 18.0% |
| Immigrants | Honduras | 0.2 /100 | #272 | Tragic 18.0% |
| Immigrants | Nepal | 0.2 /100 | #273 | Tragic 18.0% |