Immigrants from Netherlands vs Inupiat Male Disability
COMPARE
Immigrants from Netherlands
Inupiat
Male Disability
Male Disability Comparison
Immigrants from Netherlands
Inupiat
11.4%
MALE DISABILITY
25.9/ 100
METRIC RATING
189th/ 347
METRIC RANK
13.0%
MALE DISABILITY
0.0/ 100
METRIC RATING
297th/ 347
METRIC RANK
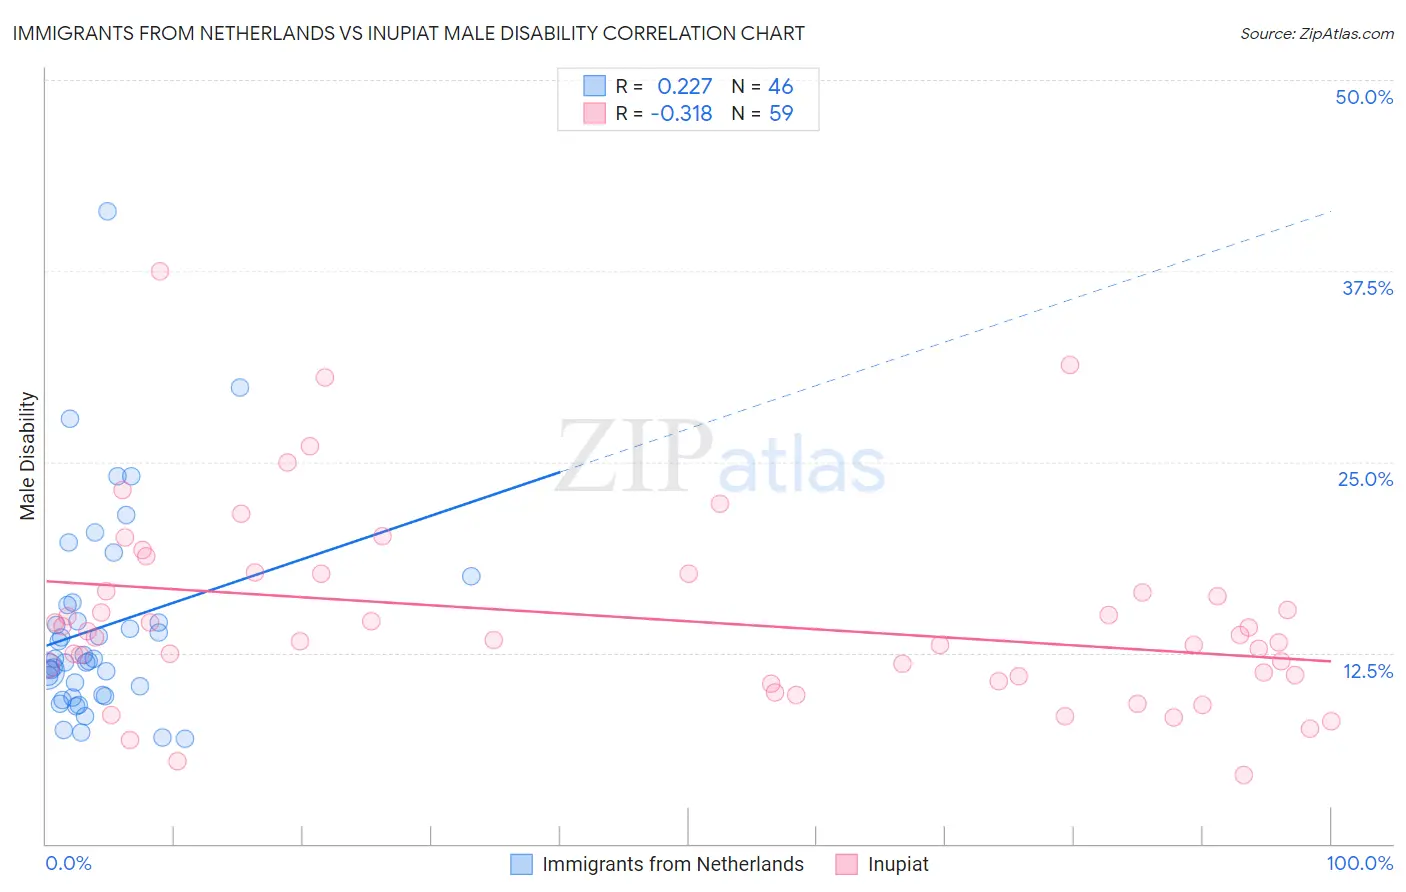
Immigrants from Netherlands vs Inupiat Male Disability Correlation Chart
The statistical analysis conducted on geographies consisting of 237,879,390 people shows a weak positive correlation between the proportion of Immigrants from Netherlands and percentage of males with a disability in the United States with a correlation coefficient (R) of 0.227 and weighted average of 11.4%. Similarly, the statistical analysis conducted on geographies consisting of 96,329,518 people shows a mild negative correlation between the proportion of Inupiat and percentage of males with a disability in the United States with a correlation coefficient (R) of -0.318 and weighted average of 13.0%, a difference of 13.8%.
Male Disability Correlation Summary
| Measurement | Immigrants from Netherlands | Inupiat |
| Minimum | 6.9% | 4.5% |
| Maximum | 41.4% | 37.5% |
| Range | 34.5% | 33.0% |
| Mean | 14.2% | 14.8% |
| Median | 12.0% | 13.5% |
| Interquartile 25% (IQ1) | 9.8% | 11.0% |
| Interquartile 75% (IQ3) | 15.6% | 17.6% |
| Interquartile Range (IQR) | 5.8% | 6.7% |
| Standard Deviation (Sample) | 6.7% | 6.3% |
| Standard Deviation (Population) | 6.6% | 6.2% |
Similar Demographics by Male Disability
Demographics Similar to Immigrants from Netherlands by Male Disability
In terms of male disability, the demographic groups most similar to Immigrants from Netherlands are Immigrants from Bosnia and Herzegovina (11.4%, a difference of 0.040%), Estonian (11.4%, a difference of 0.060%), Immigrants from Austria (11.4%, a difference of 0.10%), Immigrants from Zaire (11.4%, a difference of 0.12%), and Senegalese (11.4%, a difference of 0.20%).
| Demographics | Rating | Rank | Male Disability |
| Immigrants | Belize | 33.7 /100 | #182 | Fair 11.3% |
| Immigrants | Central America | 32.9 /100 | #183 | Fair 11.3% |
| Iraqis | 30.5 /100 | #184 | Fair 11.3% |
| Pakistanis | 30.3 /100 | #185 | Fair 11.3% |
| Immigrants | Zaire | 27.6 /100 | #186 | Fair 11.4% |
| Immigrants | Austria | 27.3 /100 | #187 | Fair 11.4% |
| Estonians | 26.8 /100 | #188 | Fair 11.4% |
| Immigrants | Netherlands | 25.9 /100 | #189 | Fair 11.4% |
| Immigrants | Bosnia and Herzegovina | 25.4 /100 | #190 | Fair 11.4% |
| Senegalese | 23.2 /100 | #191 | Fair 11.4% |
| Assyrians/Chaldeans/Syriacs | 23.2 /100 | #192 | Fair 11.4% |
| Greeks | 22.2 /100 | #193 | Fair 11.4% |
| Belizeans | 21.2 /100 | #194 | Fair 11.4% |
| Immigrants | Oceania | 20.9 /100 | #195 | Fair 11.4% |
| West Indians | 18.4 /100 | #196 | Poor 11.4% |
Demographics Similar to Inupiat by Male Disability
In terms of male disability, the demographic groups most similar to Inupiat are Nonimmigrants (12.9%, a difference of 0.11%), Immigrants from Micronesia (12.9%, a difference of 0.17%), Pennsylvania German (13.0%, a difference of 0.20%), Marshallese (12.9%, a difference of 0.27%), and Yaqui (12.9%, a difference of 0.51%).
| Demographics | Rating | Rank | Male Disability |
| Pima | 0.0 /100 | #290 | Tragic 12.8% |
| Whites/Caucasians | 0.0 /100 | #291 | Tragic 12.8% |
| English | 0.0 /100 | #292 | Tragic 12.8% |
| Yaqui | 0.0 /100 | #293 | Tragic 12.9% |
| Marshallese | 0.0 /100 | #294 | Tragic 12.9% |
| Immigrants | Micronesia | 0.0 /100 | #295 | Tragic 12.9% |
| Immigrants | Nonimmigrants | 0.0 /100 | #296 | Tragic 12.9% |
| Inupiat | 0.0 /100 | #297 | Tragic 13.0% |
| Pennsylvania Germans | 0.0 /100 | #298 | Tragic 13.0% |
| Celtics | 0.0 /100 | #299 | Tragic 13.0% |
| Cheyenne | 0.0 /100 | #300 | Tragic 13.0% |
| French | 0.0 /100 | #301 | Tragic 13.0% |
| Crow | 0.0 /100 | #302 | Tragic 13.1% |
| Scotch-Irish | 0.0 /100 | #303 | Tragic 13.2% |
| Blacks/African Americans | 0.0 /100 | #304 | Tragic 13.2% |