Immigrants from Jamaica vs Basque Cognitive Disability
COMPARE
Immigrants from Jamaica
Basque
Cognitive Disability
Cognitive Disability Comparison
Immigrants from Jamaica
Basques
17.6%
COGNITIVE DISABILITY
8.5/ 100
METRIC RATING
210th/ 347
METRIC RANK
17.1%
COGNITIVE DISABILITY
85.5/ 100
METRIC RATING
150th/ 347
METRIC RANK
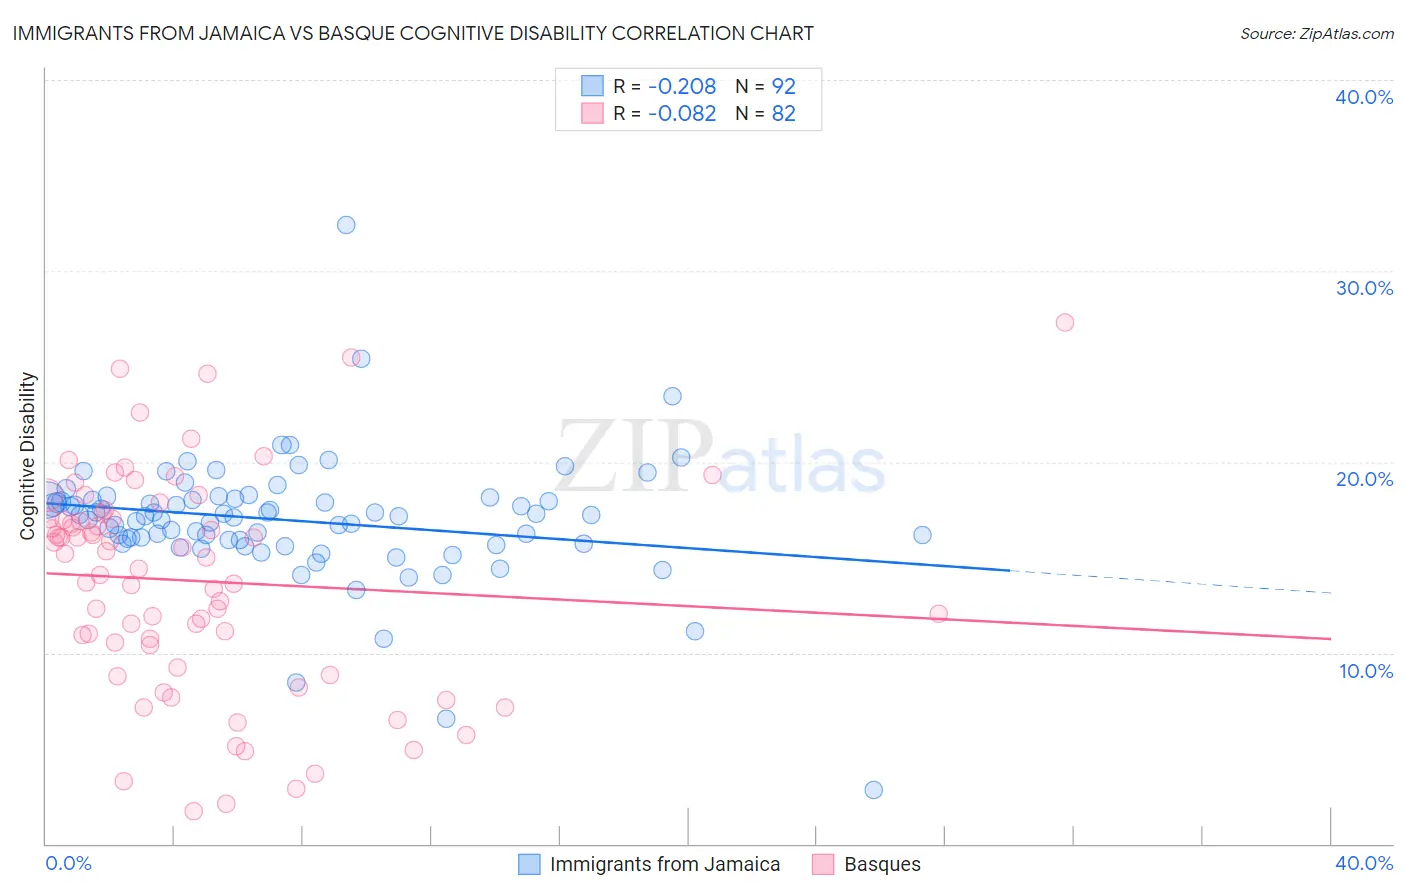
Immigrants from Jamaica vs Basque Cognitive Disability Correlation Chart
The statistical analysis conducted on geographies consisting of 301,744,234 people shows a weak negative correlation between the proportion of Immigrants from Jamaica and percentage of population with cognitive disability in the United States with a correlation coefficient (R) of -0.208 and weighted average of 17.6%. Similarly, the statistical analysis conducted on geographies consisting of 165,778,299 people shows a slight negative correlation between the proportion of Basques and percentage of population with cognitive disability in the United States with a correlation coefficient (R) of -0.082 and weighted average of 17.1%, a difference of 3.0%.
Cognitive Disability Correlation Summary
| Measurement | Immigrants from Jamaica | Basque |
| Minimum | 2.8% | 1.7% |
| Maximum | 32.4% | 27.3% |
| Range | 29.6% | 25.6% |
| Mean | 16.9% | 13.8% |
| Median | 17.2% | 15.1% |
| Interquartile 25% (IQ1) | 15.8% | 10.4% |
| Interquartile 75% (IQ3) | 18.0% | 17.1% |
| Interquartile Range (IQR) | 2.2% | 6.7% |
| Standard Deviation (Sample) | 3.4% | 5.7% |
| Standard Deviation (Population) | 3.4% | 5.6% |
Similar Demographics by Cognitive Disability
Demographics Similar to Immigrants from Jamaica by Cognitive Disability
In terms of cognitive disability, the demographic groups most similar to Immigrants from Jamaica are Immigrants from Trinidad and Tobago (17.6%, a difference of 0.020%), Immigrants from Cameroon (17.6%, a difference of 0.070%), Taiwanese (17.6%, a difference of 0.070%), Immigrants from Latin America (17.6%, a difference of 0.10%), and Immigrants from Oceania (17.6%, a difference of 0.11%).
| Demographics | Rating | Rank | Cognitive Disability |
| Immigrants | Caribbean | 11.0 /100 | #203 | Poor 17.5% |
| Immigrants | Zimbabwe | 11.0 /100 | #204 | Poor 17.5% |
| Puget Sound Salish | 10.9 /100 | #205 | Poor 17.5% |
| Alaska Natives | 10.4 /100 | #206 | Poor 17.5% |
| Immigrants | Latin America | 9.7 /100 | #207 | Tragic 17.6% |
| Immigrants | Cameroon | 9.3 /100 | #208 | Tragic 17.6% |
| Immigrants | Trinidad and Tobago | 8.7 /100 | #209 | Tragic 17.6% |
| Immigrants | Jamaica | 8.5 /100 | #210 | Tragic 17.6% |
| Taiwanese | 7.7 /100 | #211 | Tragic 17.6% |
| Immigrants | Oceania | 7.3 /100 | #212 | Tragic 17.6% |
| Hawaiians | 7.2 /100 | #213 | Tragic 17.6% |
| Immigrants | El Salvador | 7.0 /100 | #214 | Tragic 17.6% |
| Alaskan Athabascans | 6.9 /100 | #215 | Tragic 17.6% |
| Okinawans | 6.8 /100 | #216 | Tragic 17.6% |
| Salvadorans | 6.7 /100 | #217 | Tragic 17.6% |
Demographics Similar to Basques by Cognitive Disability
In terms of cognitive disability, the demographic groups most similar to Basques are French Canadian (17.1%, a difference of 0.010%), Cypriot (17.1%, a difference of 0.010%), Scotch-Irish (17.1%, a difference of 0.030%), Syrian (17.1%, a difference of 0.13%), and Immigrants from Indonesia (17.1%, a difference of 0.15%).
| Demographics | Rating | Rank | Cognitive Disability |
| British | 89.3 /100 | #143 | Excellent 17.0% |
| Immigrants | Brazil | 89.3 /100 | #144 | Excellent 17.0% |
| Immigrants | South Eastern Asia | 88.7 /100 | #145 | Excellent 17.0% |
| Costa Ricans | 88.0 /100 | #146 | Excellent 17.0% |
| Scotch-Irish | 85.9 /100 | #147 | Excellent 17.1% |
| French Canadians | 85.7 /100 | #148 | Excellent 17.1% |
| Cypriots | 85.7 /100 | #149 | Excellent 17.1% |
| Basques | 85.5 /100 | #150 | Excellent 17.1% |
| Syrians | 83.0 /100 | #151 | Excellent 17.1% |
| Immigrants | Indonesia | 82.7 /100 | #152 | Excellent 17.1% |
| Immigrants | Kazakhstan | 80.5 /100 | #153 | Excellent 17.1% |
| Immigrants | Malaysia | 79.3 /100 | #154 | Good 17.1% |
| Brazilians | 78.9 /100 | #155 | Good 17.1% |
| Sri Lankans | 78.9 /100 | #156 | Good 17.1% |
| Immigrants | Australia | 76.0 /100 | #157 | Good 17.1% |