Immigrants from Israel vs Hispanic or Latino Male Disability
COMPARE
Immigrants from Israel
Hispanic or Latino
Male Disability
Male Disability Comparison
Immigrants from Israel
Hispanics or Latinos
9.6%
MALE DISABILITY
100.0/ 100
METRIC RATING
10th/ 347
METRIC RANK
11.8%
MALE DISABILITY
2.3/ 100
METRIC RATING
228th/ 347
METRIC RANK
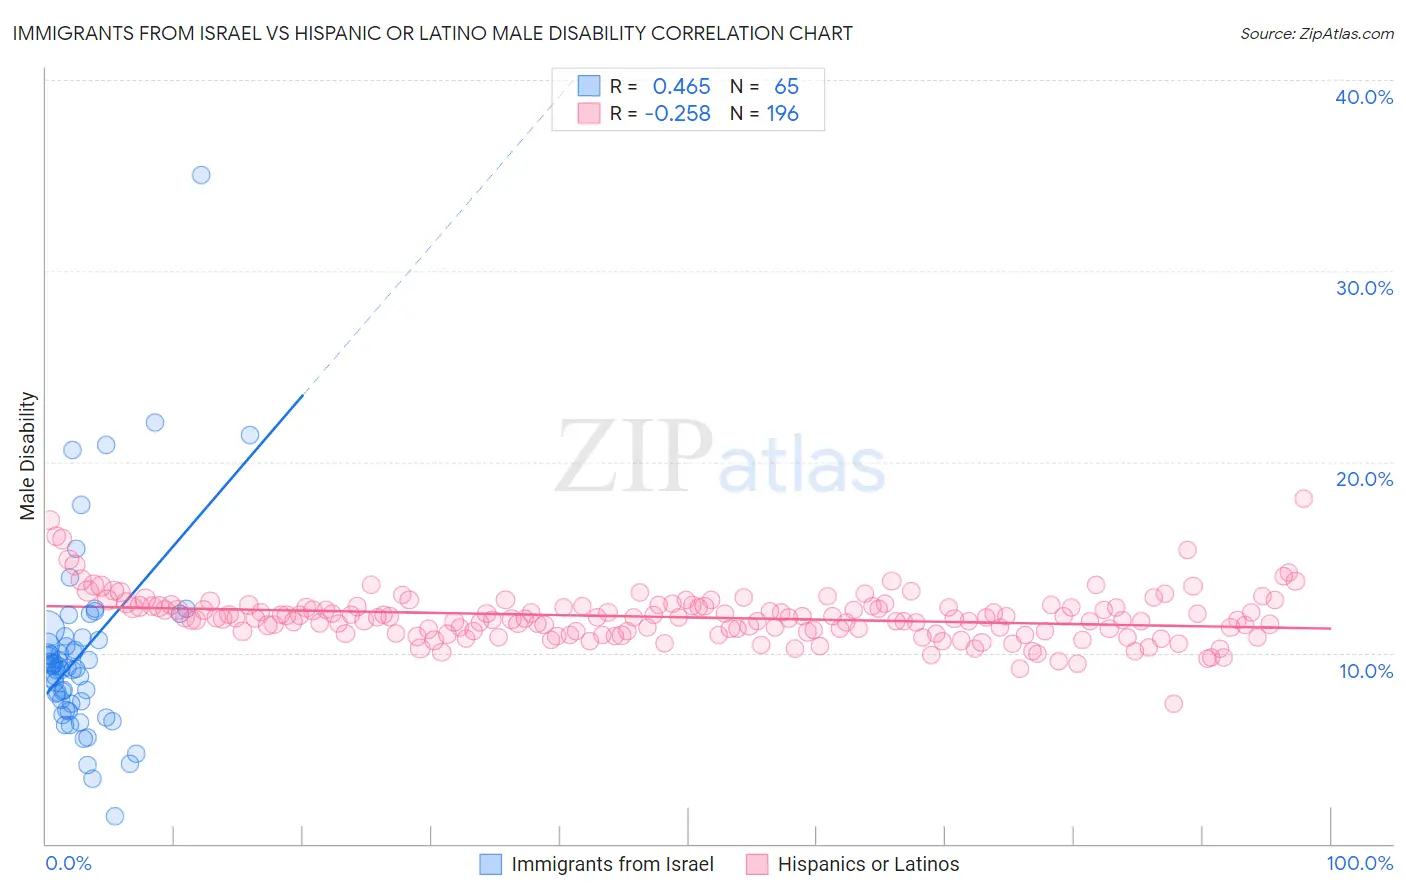
Immigrants from Israel vs Hispanic or Latino Male Disability Correlation Chart
The statistical analysis conducted on geographies consisting of 210,033,213 people shows a moderate positive correlation between the proportion of Immigrants from Israel and percentage of males with a disability in the United States with a correlation coefficient (R) of 0.465 and weighted average of 9.6%. Similarly, the statistical analysis conducted on geographies consisting of 573,649,400 people shows a weak negative correlation between the proportion of Hispanics or Latinos and percentage of males with a disability in the United States with a correlation coefficient (R) of -0.258 and weighted average of 11.8%, a difference of 23.3%.
Male Disability Correlation Summary
| Measurement | Immigrants from Israel | Hispanic or Latino |
| Minimum | 1.5% | 7.3% |
| Maximum | 35.0% | 18.1% |
| Range | 33.5% | 10.7% |
| Mean | 10.1% | 11.9% |
| Median | 9.3% | 11.8% |
| Interquartile 25% (IQ1) | 7.4% | 11.1% |
| Interquartile 75% (IQ3) | 10.8% | 12.4% |
| Interquartile Range (IQR) | 3.4% | 1.3% |
| Standard Deviation (Sample) | 5.1% | 1.3% |
| Standard Deviation (Population) | 5.1% | 1.3% |
Similar Demographics by Male Disability
Demographics Similar to Immigrants from Israel by Male Disability
In terms of male disability, the demographic groups most similar to Immigrants from Israel are Immigrants from Singapore (9.5%, a difference of 0.43%), Immigrants from China (9.5%, a difference of 0.51%), Immigrants from Eastern Asia (9.6%, a difference of 0.55%), Bolivian (9.6%, a difference of 0.79%), and Iranian (9.7%, a difference of 1.0%).
| Demographics | Rating | Rank | Male Disability |
| Filipinos | 100.0 /100 | #3 | Exceptional 9.1% |
| Thais | 100.0 /100 | #4 | Exceptional 9.2% |
| Immigrants | Hong Kong | 100.0 /100 | #5 | Exceptional 9.4% |
| Immigrants | South Central Asia | 100.0 /100 | #6 | Exceptional 9.4% |
| Immigrants | Bolivia | 100.0 /100 | #7 | Exceptional 9.5% |
| Immigrants | China | 100.0 /100 | #8 | Exceptional 9.5% |
| Immigrants | Singapore | 100.0 /100 | #9 | Exceptional 9.5% |
| Immigrants | Israel | 100.0 /100 | #10 | Exceptional 9.6% |
| Immigrants | Eastern Asia | 100.0 /100 | #11 | Exceptional 9.6% |
| Bolivians | 100.0 /100 | #12 | Exceptional 9.6% |
| Iranians | 100.0 /100 | #13 | Exceptional 9.7% |
| Immigrants | Iran | 100.0 /100 | #14 | Exceptional 9.7% |
| Indians (Asian) | 100.0 /100 | #15 | Exceptional 9.7% |
| Okinawans | 100.0 /100 | #16 | Exceptional 9.8% |
| Immigrants | Korea | 100.0 /100 | #17 | Exceptional 9.8% |
Demographics Similar to Hispanics or Latinos by Male Disability
In terms of male disability, the demographic groups most similar to Hispanics or Latinos are Bermudan (11.8%, a difference of 0.030%), Austrian (11.8%, a difference of 0.080%), Croatian (11.8%, a difference of 0.12%), Subsaharan African (11.8%, a difference of 0.26%), and Dominican (11.8%, a difference of 0.32%).
| Demographics | Rating | Rank | Male Disability |
| Immigrants | Congo | 3.7 /100 | #221 | Tragic 11.7% |
| Alsatians | 3.3 /100 | #222 | Tragic 11.7% |
| Immigrants | Bahamas | 3.2 /100 | #223 | Tragic 11.7% |
| Japanese | 3.1 /100 | #224 | Tragic 11.7% |
| Liberians | 3.1 /100 | #225 | Tragic 11.8% |
| Sub-Saharan Africans | 2.8 /100 | #226 | Tragic 11.8% |
| Austrians | 2.5 /100 | #227 | Tragic 11.8% |
| Hispanics or Latinos | 2.3 /100 | #228 | Tragic 11.8% |
| Bermudans | 2.3 /100 | #229 | Tragic 11.8% |
| Croatians | 2.1 /100 | #230 | Tragic 11.8% |
| Dominicans | 1.8 /100 | #231 | Tragic 11.8% |
| Malaysians | 1.8 /100 | #232 | Tragic 11.8% |
| Mexicans | 1.7 /100 | #233 | Tragic 11.8% |
| Immigrants | Canada | 1.6 /100 | #234 | Tragic 11.9% |
| Immigrants | North America | 1.5 /100 | #235 | Tragic 11.9% |