Immigrants from Israel vs Immigrants from Switzerland Male Disability

COMPARE

Immigrants from Israel
Race
Ancestry
AfghanAfricanAlaska NativeAlaskan AthabascanAlbanianAleutAlsatianAmericanApacheArabArapahoArgentineanArmenianAssyrian/Chaldean/SyriacAustralianAustrianBahamianBangladeshiBarbadianBasqueBelgianBelizeanBermudanBhutaneseBlackfeetBolivianBrazilianBritishBritish West IndianBulgarianBurmeseCajunCambodianCanadianCape VerdeanCarpatho RusynCelticCentral AmericanCentral American IndianCherokeeCheyenneChickasawChileanChineseChippewaChoctawColombianColvilleComancheCosta RicanCreeCreekCroatianCrowCubanCypriotCzechCzechoslovakianDanishDelawareDominicanDutchDutch West IndianEastern EuropeanEcuadorianEgyptianEnglishEstonianEthiopianEuropeanFijianFilipinoFinnishFrenchFrench American IndianFrench CanadianGermanGerman RussianGhanaianGreekGuamanian/ChamorroGuatemalanGuyaneseHaitianHmongHonduranHopiHoumaHungarianIcelanderIndian (Asian)IndonesianInupiatIranianIraqiIrishIroquoisIsraeliItalianJamaicanJapaneseJordanianKenyanKiowaKoreanLaotianLatvianLebaneseLiberianLithuanianLumbeeLuxembourgerMacedonianMalaysianMalteseMarshalleseMenomineeMexicanMexican American IndianMongolianMoroccanNative HawaiianNavajoNepaleseNew ZealanderNicaraguanNigerianNorthern EuropeanNorwegianOkinawanOsageOttawaPaiutePakistaniPalestinianPanamanianParaguayanPennsylvania GermanPeruvianPimaPolishPortuguesePotawatomiPuebloPuerto RicanPuget Sound SalishRomanianRussianSalvadoranSamoanScandinavianScotch-IrishScottishSeminoleSenegaleseSerbianShoshoneSierra LeoneanSiouxSlavicSlovakSloveneSomaliSouth AfricanSouth AmericanSouth American IndianSoviet UnionSpaniardSpanishSpanish AmericanSpanish American IndianSri LankanSubsaharan AfricanSudaneseSwedishSwissSyrianTaiwaneseThaiTlingit-HaidaTohono O'OdhamTonganTrinidadian and TobagonianTsimshianTurkishU.S. Virgin IslanderUgandanUkrainianUruguayanUteVenezuelanVietnameseWelshWest IndianYakamaYaquiYugoslavianYumanYup'ikZimbabwean
Immigration
NonimmigrantsImmigrantsAfghanistanAfricaAlbaniaArgentinaArmeniaAsiaAustraliaAustriaBahamasBangladeshBarbadosBelarusBelgiumBelizeBoliviaBosnia and HerzegovinaBrazilBulgariaBurma/MyanmarCabo VerdeCambodiaCameroonCanadaCaribbeanCentral AmericaChileChinaColombiaCongoCosta RicaCroatiaCubaCzechoslovakiaDenmarkDominicaDominican RepublicEastern AfricaEastern AsiaEastern EuropeEcuadorEgyptEl SalvadorEnglandEritreaEthiopiaEuropeFijiFranceGermanyGhanaGreeceGrenadaGuatemalaGuyanaHaitiHondurasHong KongHungaryIndiaIndonesiaIranIraqIrelandIsraelItalyJamaicaJapanJordanKazakhstanKenyaKoreaKuwaitLaosLatin AmericaLatviaLebanonLiberiaLithuaniaMalaysiaMexicoMicronesiaMiddle AfricaMoldovaMoroccoNepalNetherlandsNicaraguaNigeriaNorth AmericaNorth MacedoniaNorthern AfricaNorthern EuropeNorwayOceaniaPakistanPanamaPeruPhilippinesPolandPortugalRomaniaRussiaSaudi ArabiaScotlandSenegalSerbiaSierra LeoneSingaporeSomaliaSouth AfricaSouth AmericaSouth Central AsiaSouth Eastern AsiaSouthern EuropeSpainSri LankaSt. Vincent and the GrenadinesSudanSwedenSyriaTaiwanThailandTrinidad and TobagoTurkeyUgandaUkraineUruguayUzbekistanVenezuelaVietnamWest IndiesWestern AfricaWestern AsiaWestern EuropeYemenZaireZimbabweAzores
Immigrants from Switzerland
Race
Ancestry
AfghanAfricanAlaska NativeAlaskan AthabascanAlbanianAleutAlsatianAmericanApacheArabArapahoArgentineanArmenianAssyrian/Chaldean/SyriacAustralianAustrianBahamianBangladeshiBarbadianBasqueBelgianBelizeanBermudanBhutaneseBlackfeetBolivianBrazilianBritishBritish West IndianBulgarianBurmeseCajunCambodianCanadianCape VerdeanCarpatho RusynCelticCentral AmericanCentral American IndianCherokeeCheyenneChickasawChileanChineseChippewaChoctawColombianColvilleComancheCosta RicanCreeCreekCroatianCrowCubanCypriotCzechCzechoslovakianDanishDelawareDominicanDutchDutch West IndianEastern EuropeanEcuadorianEgyptianEnglishEstonianEthiopianEuropeanFijianFilipinoFinnishFrenchFrench American IndianFrench CanadianGermanGerman RussianGhanaianGreekGuamanian/ChamorroGuatemalanGuyaneseHaitianHmongHonduranHopiHoumaHungarianIcelanderIndian (Asian)IndonesianInupiatIranianIraqiIrishIroquoisIsraeliItalianJamaicanJapaneseJordanianKenyanKiowaKoreanLaotianLatvianLebaneseLiberianLithuanianLumbeeLuxembourgerMacedonianMalaysianMalteseMarshalleseMenomineeMexicanMexican American IndianMongolianMoroccanNative HawaiianNavajoNepaleseNew ZealanderNicaraguanNigerianNorthern EuropeanNorwegianOkinawanOsageOttawaPaiutePakistaniPalestinianPanamanianParaguayanPennsylvania GermanPeruvianPimaPolishPortuguesePotawatomiPuebloPuerto RicanPuget Sound SalishRomanianRussianSalvadoranSamoanScandinavianScotch-IrishScottishSeminoleSenegaleseSerbianShoshoneSierra LeoneanSiouxSlavicSlovakSloveneSomaliSouth AfricanSouth AmericanSouth American IndianSoviet UnionSpaniardSpanishSpanish AmericanSpanish American IndianSri LankanSubsaharan AfricanSudaneseSwedishSwissSyrianTaiwaneseThaiTlingit-HaidaTohono O'OdhamTonganTrinidadian and TobagonianTsimshianTurkishU.S. Virgin IslanderUgandanUkrainianUruguayanUteVenezuelanVietnameseWelshWest IndianYakamaYaquiYugoslavianYumanYup'ikZimbabwean
Immigration
NonimmigrantsImmigrantsAfghanistanAfricaAlbaniaArgentinaArmeniaAsiaAustraliaAustriaBahamasBangladeshBarbadosBelarusBelgiumBelizeBoliviaBosnia and HerzegovinaBrazilBulgariaBurma/MyanmarCabo VerdeCambodiaCameroonCanadaCaribbeanCentral AmericaChileChinaColombiaCongoCosta RicaCroatiaCubaCzechoslovakiaDenmarkDominicaDominican RepublicEastern AfricaEastern AsiaEastern EuropeEcuadorEgyptEl SalvadorEnglandEritreaEthiopiaEuropeFijiFranceGermanyGhanaGreeceGrenadaGuatemalaGuyanaHaitiHondurasHong KongHungaryIndiaIndonesiaIranIraqIrelandItalyJamaicaJapanJordanKazakhstanKenyaKoreaKuwaitLaosLatin AmericaLatviaLebanonLiberiaLithuaniaMalaysiaMexicoMicronesiaMiddle AfricaMoldovaMoroccoNepalNetherlandsNicaraguaNigeriaNorth AmericaNorth MacedoniaNorthern AfricaNorthern EuropeNorwayOceaniaPakistanPanamaPeruPhilippinesPolandPortugalRomaniaRussiaSaudi ArabiaScotlandSenegalSerbiaSierra LeoneSingaporeSomaliaSouth AfricaSouth AmericaSouth Central AsiaSouth Eastern AsiaSouthern EuropeSpainSri LankaSt. Vincent and the GrenadinesSudanSwedenSwitzerlandSyriaTaiwanThailandTrinidad and TobagoTurkeyUgandaUkraineUruguayUzbekistanVenezuelaVietnamWest IndiesWestern AfricaWestern AsiaWestern EuropeYemenZaireZimbabweAzores
Male Disability
Income
Poverty
Unemployment
Labor Participation
Family Structure
Vehicle Availability
Education Level
Disability

Male Disability Comparison

Immigrants from Israel

Immigrants from Switzerland

Exceptional
Exceptional
9.6%
MALE DISABILITY
100.0/ 100
METRIC RATING
10th/ 347
METRIC RANK
10.7%
MALE DISABILITY
96.1/ 100
METRIC RATING
99th/ 347
METRIC RANK

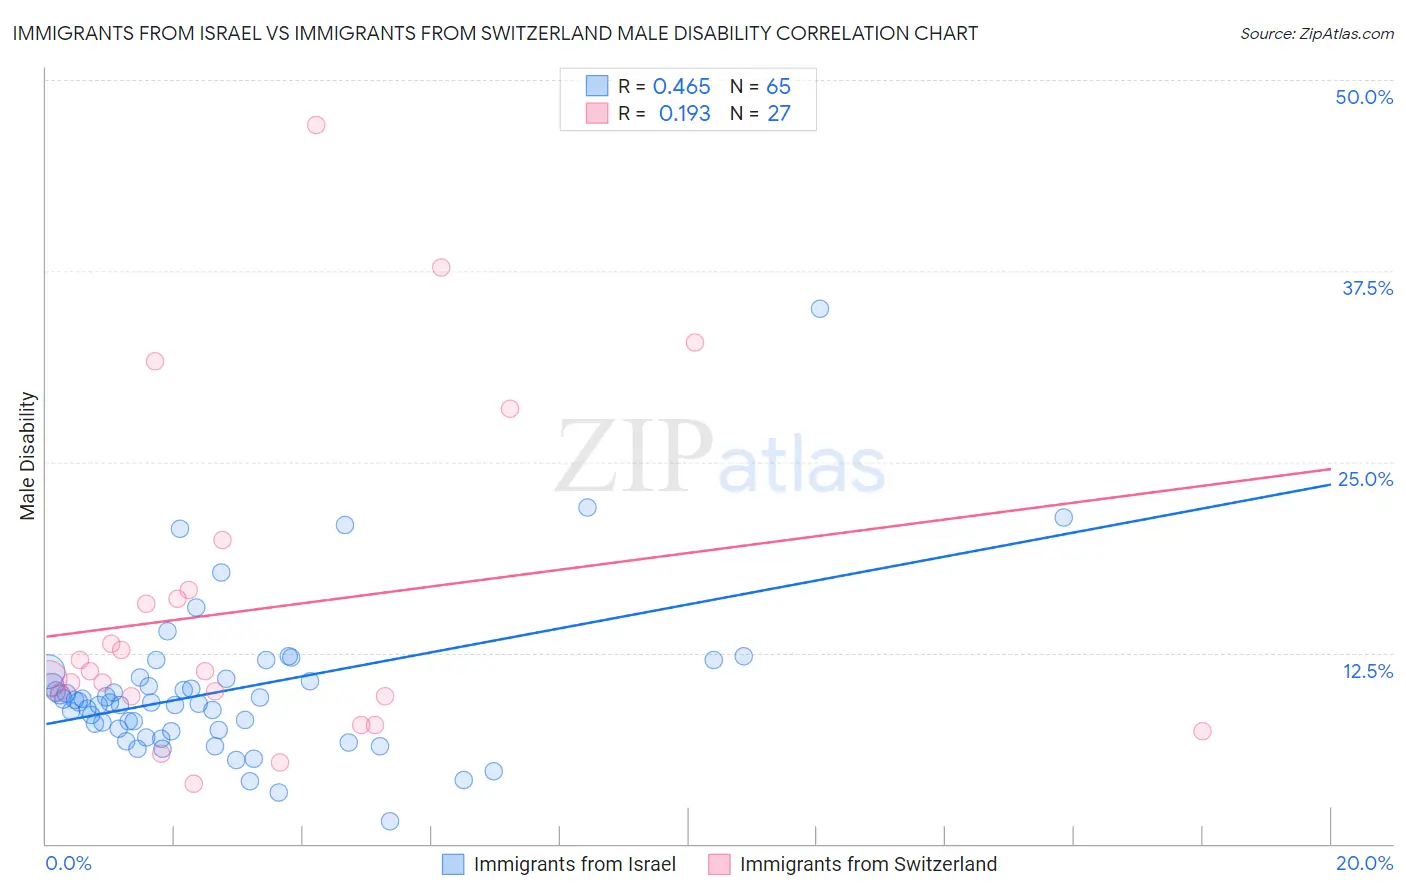
Immigrants from Israel vs Immigrants from Switzerland Male Disability Correlation Chart

The statistical analysis conducted on geographies consisting of 210,033,213 people shows a moderate positive correlation between the proportion of Immigrants from Israel and percentage of males with a disability in the United States with a correlation coefficient (R) of 0.465 and weighted average of 9.6%. Similarly, the statistical analysis conducted on geographies consisting of 148,082,366 people shows a poor positive correlation between the proportion of Immigrants from Switzerland and percentage of males with a disability in the United States with a correlation coefficient (R) of 0.193 and weighted average of 10.7%, a difference of 12.0%.
Immigrants from Israel vs Immigrants from Switzerland Male Disability

Male Disability Correlation Summary

MeasurementImmigrants from IsraelImmigrants from Switzerland
Minimum1.5%4.0%
Maximum35.0%47.1%
Range33.5%43.1%
Mean10.1%15.4%
Median9.3%11.3%
Interquartile 25% (IQ1)7.4%9.6%
Interquartile 75% (IQ3)10.8%16.6%
Interquartile Range (IQR)3.4%7.0%
Standard Deviation (Sample)5.1%10.8%
Standard Deviation (Population)5.1%10.6%

Similar Demographics by Male Disability

Demographics Similar to Immigrants from Israel by Male Disability

In terms of male disability, the demographic groups most similar to Immigrants from Israel are Immigrants from Singapore (9.5%, a difference of 0.43%), Immigrants from China (9.5%, a difference of 0.51%), Immigrants from Eastern Asia (9.6%, a difference of 0.55%), Bolivian (9.6%, a difference of 0.79%), and Iranian (9.7%, a difference of 1.0%).
DemographicsRating | RankMale Disability
Filipinos
100.0
/100
|
#3
Exceptional
9.1%
Thais
100.0
/100
|
#4
Exceptional
9.2%
Immigrants | Hong Kong
100.0
/100
|
#5
Exceptional
9.4%
Immigrants | South Central Asia
100.0
/100
|
#6
Exceptional
9.4%
Immigrants | Bolivia
100.0
/100
|
#7
Exceptional
9.5%
Immigrants | China
100.0
/100
|
#8
Exceptional
9.5%
Immigrants | Singapore
100.0
/100
|
#9
Exceptional
9.5%
Immigrants | Israel
100.0
/100
|
#10
Exceptional
9.6%
Immigrants | Eastern Asia
100.0
/100
|
#11
Exceptional
9.6%
Bolivians
100.0
/100
|
#12
Exceptional
9.6%
Iranians
100.0
/100
|
#13
Exceptional
9.7%
Immigrants | Iran
100.0
/100
|
#14
Exceptional
9.7%
Indians (Asian)
100.0
/100
|
#15
Exceptional
9.7%
Okinawans
100.0
/100
|
#16
Exceptional
9.8%
Immigrants | Korea
100.0
/100
|
#17
Exceptional
9.8%

Demographics Similar to Immigrants from Switzerland by Male Disability

In terms of male disability, the demographic groups most similar to Immigrants from Switzerland are Immigrants from Kazakhstan (10.7%, a difference of 0.070%), Immigrants from Romania (10.7%, a difference of 0.14%), Immigrants from Greece (10.7%, a difference of 0.18%), Immigrants from Armenia (10.7%, a difference of 0.20%), and Nicaraguan (10.7%, a difference of 0.22%).
DemographicsRating | RankMale Disability
Palestinians
97.4
/100
|
#92
Exceptional
10.7%
Immigrants | St. Vincent and the Grenadines
97.1
/100
|
#93
Exceptional
10.7%
Immigrants | Sweden
96.9
/100
|
#94
Exceptional
10.7%
Chileans
96.9
/100
|
#95
Exceptional
10.7%
Nicaraguans
96.6
/100
|
#96
Exceptional
10.7%
Immigrants | Armenia
96.6
/100
|
#97
Exceptional
10.7%
Immigrants | Romania
96.5
/100
|
#98
Exceptional
10.7%
Immigrants | Switzerland
96.1
/100
|
#99
Exceptional
10.7%
Immigrants | Kazakhstan
95.9
/100
|
#100
Exceptional
10.7%
Immigrants | Greece
95.6
/100
|
#101
Exceptional
10.7%
Immigrants | Eastern Europe
95.3
/100
|
#102
Exceptional
10.7%
Uruguayans
95.3
/100
|
#103
Exceptional
10.7%
Immigrants | Nigeria
95.1
/100
|
#104
Exceptional
10.8%
Immigrants | Brazil
95.0
/100
|
#105
Exceptional
10.8%
Immigrants | Syria
94.9
/100
|
#106
Exceptional
10.8%