Immigrants from Hungary vs Immigrants from the Azores Male Disability

COMPARE

Immigrants from Hungary
Race
Ancestry
AfghanAfricanAlaska NativeAlaskan AthabascanAlbanianAleutAlsatianAmericanApacheArabArapahoArgentineanArmenianAssyrian/Chaldean/SyriacAustralianAustrianBahamianBangladeshiBarbadianBasqueBelgianBelizeanBermudanBhutaneseBlackfeetBolivianBrazilianBritishBritish West IndianBulgarianBurmeseCajunCambodianCanadianCape VerdeanCarpatho RusynCelticCentral AmericanCentral American IndianCherokeeCheyenneChickasawChileanChineseChippewaChoctawColombianColvilleComancheCosta RicanCreeCreekCroatianCrowCubanCypriotCzechCzechoslovakianDanishDelawareDominicanDutchDutch West IndianEastern EuropeanEcuadorianEgyptianEnglishEstonianEthiopianEuropeanFijianFilipinoFinnishFrenchFrench American IndianFrench CanadianGermanGerman RussianGhanaianGreekGuamanian/ChamorroGuatemalanGuyaneseHaitianHmongHonduranHopiHoumaHungarianIcelanderIndian (Asian)IndonesianInupiatIranianIraqiIrishIroquoisIsraeliItalianJamaicanJapaneseJordanianKenyanKiowaKoreanLaotianLatvianLebaneseLiberianLithuanianLumbeeLuxembourgerMacedonianMalaysianMalteseMarshalleseMenomineeMexicanMexican American IndianMongolianMoroccanNative HawaiianNavajoNepaleseNew ZealanderNicaraguanNigerianNorthern EuropeanNorwegianOkinawanOsageOttawaPaiutePakistaniPalestinianPanamanianParaguayanPennsylvania GermanPeruvianPimaPolishPortuguesePotawatomiPuebloPuerto RicanPuget Sound SalishRomanianRussianSalvadoranSamoanScandinavianScotch-IrishScottishSeminoleSenegaleseSerbianShoshoneSierra LeoneanSiouxSlavicSlovakSloveneSomaliSouth AfricanSouth AmericanSouth American IndianSoviet UnionSpaniardSpanishSpanish AmericanSpanish American IndianSri LankanSubsaharan AfricanSudaneseSwedishSwissSyrianTaiwaneseThaiTlingit-HaidaTohono O'OdhamTonganTrinidadian and TobagonianTsimshianTurkishU.S. Virgin IslanderUgandanUkrainianUruguayanUteVenezuelanVietnameseWelshWest IndianYakamaYaquiYugoslavianYumanYup'ikZimbabwean
Immigration
NonimmigrantsImmigrantsAfghanistanAfricaAlbaniaArgentinaArmeniaAsiaAustraliaAustriaBahamasBangladeshBarbadosBelarusBelgiumBelizeBoliviaBosnia and HerzegovinaBrazilBulgariaBurma/MyanmarCabo VerdeCambodiaCameroonCanadaCaribbeanCentral AmericaChileChinaColombiaCongoCosta RicaCroatiaCubaCzechoslovakiaDenmarkDominicaDominican RepublicEastern AfricaEastern AsiaEastern EuropeEcuadorEgyptEl SalvadorEnglandEritreaEthiopiaEuropeFijiFranceGermanyGhanaGreeceGrenadaGuatemalaGuyanaHaitiHondurasHong KongHungaryIndiaIndonesiaIranIraqIrelandIsraelItalyJamaicaJapanJordanKazakhstanKenyaKoreaKuwaitLaosLatin AmericaLatviaLebanonLiberiaLithuaniaMalaysiaMexicoMicronesiaMiddle AfricaMoldovaMoroccoNepalNetherlandsNicaraguaNigeriaNorth AmericaNorth MacedoniaNorthern AfricaNorthern EuropeNorwayOceaniaPakistanPanamaPeruPhilippinesPolandPortugalRomaniaRussiaSaudi ArabiaScotlandSenegalSerbiaSierra LeoneSingaporeSomaliaSouth AfricaSouth AmericaSouth Central AsiaSouth Eastern AsiaSouthern EuropeSpainSri LankaSt. Vincent and the GrenadinesSudanSwedenSwitzerlandSyriaTaiwanThailandTrinidad and TobagoTurkeyUgandaUkraineUruguayUzbekistanVenezuelaVietnamWest IndiesWestern AfricaWestern AsiaWestern EuropeYemenZaireZimbabwe
Immigrants from the Azores
Race
Ancestry
AfghanAfricanAlaska NativeAlaskan AthabascanAlbanianAleutAlsatianAmericanApacheArabArapahoArgentineanArmenianAssyrian/Chaldean/SyriacAustralianAustrianBahamianBangladeshiBarbadianBasqueBelgianBelizeanBermudanBhutaneseBlackfeetBolivianBrazilianBritishBritish West IndianBulgarianBurmeseCajunCambodianCanadianCape VerdeanCarpatho RusynCelticCentral AmericanCentral American IndianCherokeeCheyenneChickasawChileanChineseChippewaChoctawColombianColvilleComancheCosta RicanCreeCreekCroatianCrowCubanCypriotCzechCzechoslovakianDanishDelawareDominicanDutchDutch West IndianEastern EuropeanEcuadorianEgyptianEnglishEstonianEthiopianEuropeanFijianFilipinoFinnishFrenchFrench American IndianFrench CanadianGermanGerman RussianGhanaianGreekGuamanian/ChamorroGuatemalanGuyaneseHaitianHmongHonduranHopiHoumaHungarianIcelanderIndian (Asian)IndonesianInupiatIranianIraqiIrishIroquoisIsraeliItalianJamaicanJapaneseJordanianKenyanKiowaKoreanLaotianLatvianLebaneseLiberianLithuanianLumbeeLuxembourgerMacedonianMalaysianMalteseMarshalleseMenomineeMexicanMexican American IndianMongolianMoroccanNative HawaiianNavajoNepaleseNew ZealanderNicaraguanNigerianNorthern EuropeanNorwegianOkinawanOsageOttawaPaiutePakistaniPalestinianPanamanianParaguayanPennsylvania GermanPeruvianPimaPolishPortuguesePotawatomiPuebloPuerto RicanPuget Sound SalishRomanianRussianSalvadoranSamoanScandinavianScotch-IrishScottishSeminoleSenegaleseSerbianShoshoneSierra LeoneanSiouxSlavicSlovakSloveneSomaliSouth AfricanSouth AmericanSouth American IndianSoviet UnionSpaniardSpanishSpanish AmericanSpanish American IndianSri LankanSubsaharan AfricanSudaneseSwedishSwissSyrianTaiwaneseThaiTlingit-HaidaTohono O'OdhamTonganTrinidadian and TobagonianTsimshianTurkishU.S. Virgin IslanderUgandanUkrainianUruguayanUteVenezuelanVietnameseWelshWest IndianYakamaYaquiYugoslavianYumanYup'ikZimbabwean
Immigration
NonimmigrantsImmigrantsAfghanistanAfricaAlbaniaArgentinaArmeniaAsiaAustraliaAustriaBahamasBangladeshBarbadosBelarusBelgiumBelizeBoliviaBosnia and HerzegovinaBrazilBulgariaBurma/MyanmarCabo VerdeCambodiaCameroonCanadaCaribbeanCentral AmericaChileChinaColombiaCongoCosta RicaCroatiaCubaCzechoslovakiaDenmarkDominicaDominican RepublicEastern AfricaEastern AsiaEastern EuropeEcuadorEgyptEl SalvadorEnglandEritreaEthiopiaEuropeFijiFranceGermanyGhanaGreeceGrenadaGuatemalaGuyanaHaitiHondurasHong KongIndiaIndonesiaIranIraqIrelandIsraelItalyJamaicaJapanJordanKazakhstanKenyaKoreaKuwaitLaosLatin AmericaLatviaLebanonLiberiaLithuaniaMalaysiaMexicoMicronesiaMiddle AfricaMoldovaMoroccoNepalNetherlandsNicaraguaNigeriaNorth AmericaNorth MacedoniaNorthern AfricaNorthern EuropeNorwayOceaniaPakistanPanamaPeruPhilippinesPolandPortugalRomaniaRussiaSaudi ArabiaScotlandSenegalSerbiaSierra LeoneSingaporeSomaliaSouth AfricaSouth AmericaSouth Central AsiaSouth Eastern AsiaSouthern EuropeSpainSri LankaSt. Vincent and the GrenadinesSudanSwedenSwitzerlandSyriaTaiwanThailandTrinidad and TobagoTurkeyUgandaUkraineUruguayUzbekistanVenezuelaVietnamWest IndiesWestern AfricaWestern AsiaWestern EuropeYemenZaireZimbabweAzores
Male Disability
Income
Poverty
Unemployment
Labor Participation
Family Structure
Vehicle Availability
Education Level
Disability

Male Disability Comparison

Immigrants from Hungary

Immigrants from the Azores

Good
Tragic
11.1%
MALE DISABILITY
61.2/ 100
METRIC RATING
166th/ 347
METRIC RANK
13.4%
MALE DISABILITY
0.0/ 100
METRIC RATING
310th/ 347
METRIC RANK

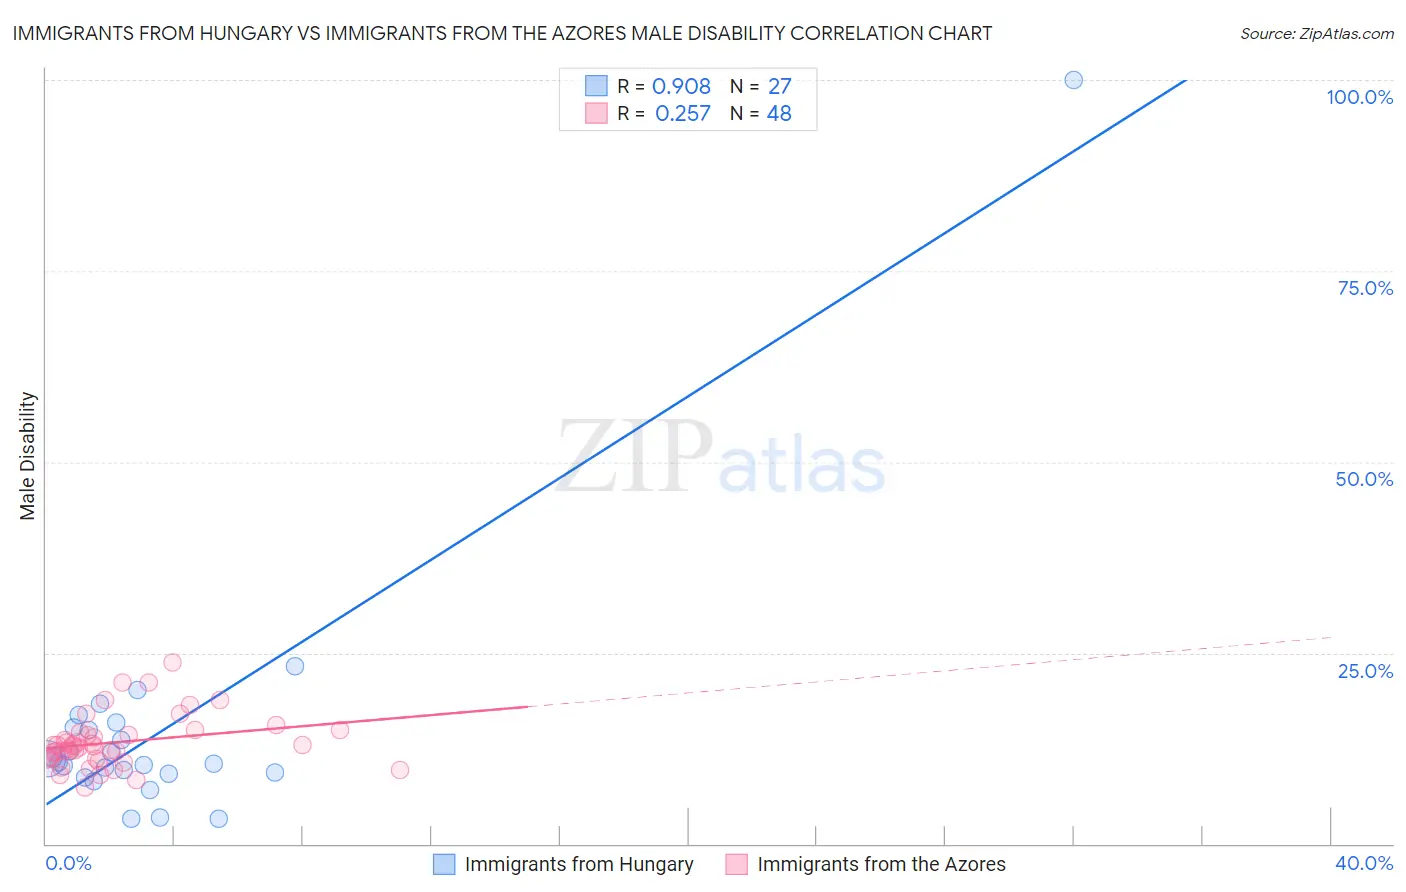
Immigrants from Hungary vs Immigrants from the Azores Male Disability Correlation Chart

The statistical analysis conducted on geographies consisting of 195,705,126 people shows a near-perfect positive correlation between the proportion of Immigrants from Hungary and percentage of males with a disability in the United States with a correlation coefficient (R) of 0.908 and weighted average of 11.1%. Similarly, the statistical analysis conducted on geographies consisting of 46,257,178 people shows a weak positive correlation between the proportion of Immigrants from the Azores and percentage of males with a disability in the United States with a correlation coefficient (R) of 0.257 and weighted average of 13.4%, a difference of 20.6%.
Immigrants from Hungary vs Immigrants from the Azores Male Disability

Male Disability Correlation Summary

MeasurementImmigrants from HungaryImmigrants from the Azores
Minimum3.2%7.4%
Maximum100.0%23.7%
Range96.8%16.3%
Mean14.7%13.3%
Median10.7%12.8%
Interquartile 25% (IQ1)9.1%11.2%
Interquartile 75% (IQ3)15.3%14.4%
Interquartile Range (IQR)6.1%3.2%
Standard Deviation (Sample)17.7%3.4%
Standard Deviation (Population)17.4%3.4%

Similar Demographics by Male Disability

Demographics Similar to Immigrants from Hungary by Male Disability

In terms of male disability, the demographic groups most similar to Immigrants from Hungary are Luxembourger (11.1%, a difference of 0.040%), British West Indian (11.1%, a difference of 0.090%), Immigrants from Kenya (11.1%, a difference of 0.15%), Immigrants from Haiti (11.1%, a difference of 0.25%), and Immigrants from West Indies (11.1%, a difference of 0.27%).
DemographicsRating | RankMale Disability
Guatemalans
67.2
/100
|
#159
Good
11.1%
Albanians
66.5
/100
|
#160
Good
11.1%
Immigrants | West Indies
65.7
/100
|
#161
Good
11.1%
Immigrants | Haiti
65.3
/100
|
#162
Good
11.1%
Immigrants | Kenya
63.8
/100
|
#163
Good
11.1%
British West Indians
62.8
/100
|
#164
Good
11.1%
Luxembourgers
61.9
/100
|
#165
Good
11.1%
Immigrants | Hungary
61.2
/100
|
#166
Good
11.1%
Immigrants | Southern Europe
54.4
/100
|
#167
Average
11.2%
Immigrants | Latin America
54.0
/100
|
#168
Average
11.2%
Barbadians
53.4
/100
|
#169
Average
11.2%
New Zealanders
52.9
/100
|
#170
Average
11.2%
Haitians
52.5
/100
|
#171
Average
11.2%
Romanians
50.7
/100
|
#172
Average
11.2%
Immigrants | Burma/Myanmar
50.4
/100
|
#173
Average
11.2%

Demographics Similar to Immigrants from the Azores by Male Disability

In terms of male disability, the demographic groups most similar to Immigrants from the Azores are Blackfeet (13.4%, a difference of 0.14%), Delaware (13.5%, a difference of 0.19%), French American Indian (13.4%, a difference of 0.56%), Arapaho (13.3%, a difference of 0.72%), and Yakama (13.5%, a difference of 0.74%).
DemographicsRating | RankMale Disability
Scotch-Irish
0.0
/100
|
#303
Tragic
13.2%
Blacks/African Americans
0.0
/100
|
#304
Tragic
13.2%
French Canadians
0.0
/100
|
#305
Tragic
13.3%
Spanish Americans
0.0
/100
|
#306
Tragic
13.3%
Arapaho
0.0
/100
|
#307
Tragic
13.3%
French American Indians
0.0
/100
|
#308
Tragic
13.4%
Blackfeet
0.0
/100
|
#309
Tragic
13.4%
Immigrants | Azores
0.0
/100
|
#310
Tragic
13.4%
Delaware
0.0
/100
|
#311
Tragic
13.5%
Yakama
0.0
/100
|
#312
Tragic
13.5%
Puget Sound Salish
0.0
/100
|
#313
Tragic
13.5%
Aleuts
0.0
/100
|
#314
Tragic
13.5%
Iroquois
0.0
/100
|
#315
Tragic
13.6%
Alaska Natives
0.0
/100
|
#316
Tragic
13.6%
Paiute
0.0
/100
|
#317
Tragic
13.7%