Immigrants from Honduras vs Immigrants from Eastern Africa Male Disability
COMPARE
Immigrants from Honduras
Immigrants from Eastern Africa
Male Disability
Male Disability Comparison
Immigrants from Honduras
Immigrants from Eastern Africa
11.2%
MALE DISABILITY
48.7/ 100
METRIC RATING
175th/ 347
METRIC RANK
10.8%
MALE DISABILITY
94.3/ 100
METRIC RATING
107th/ 347
METRIC RANK
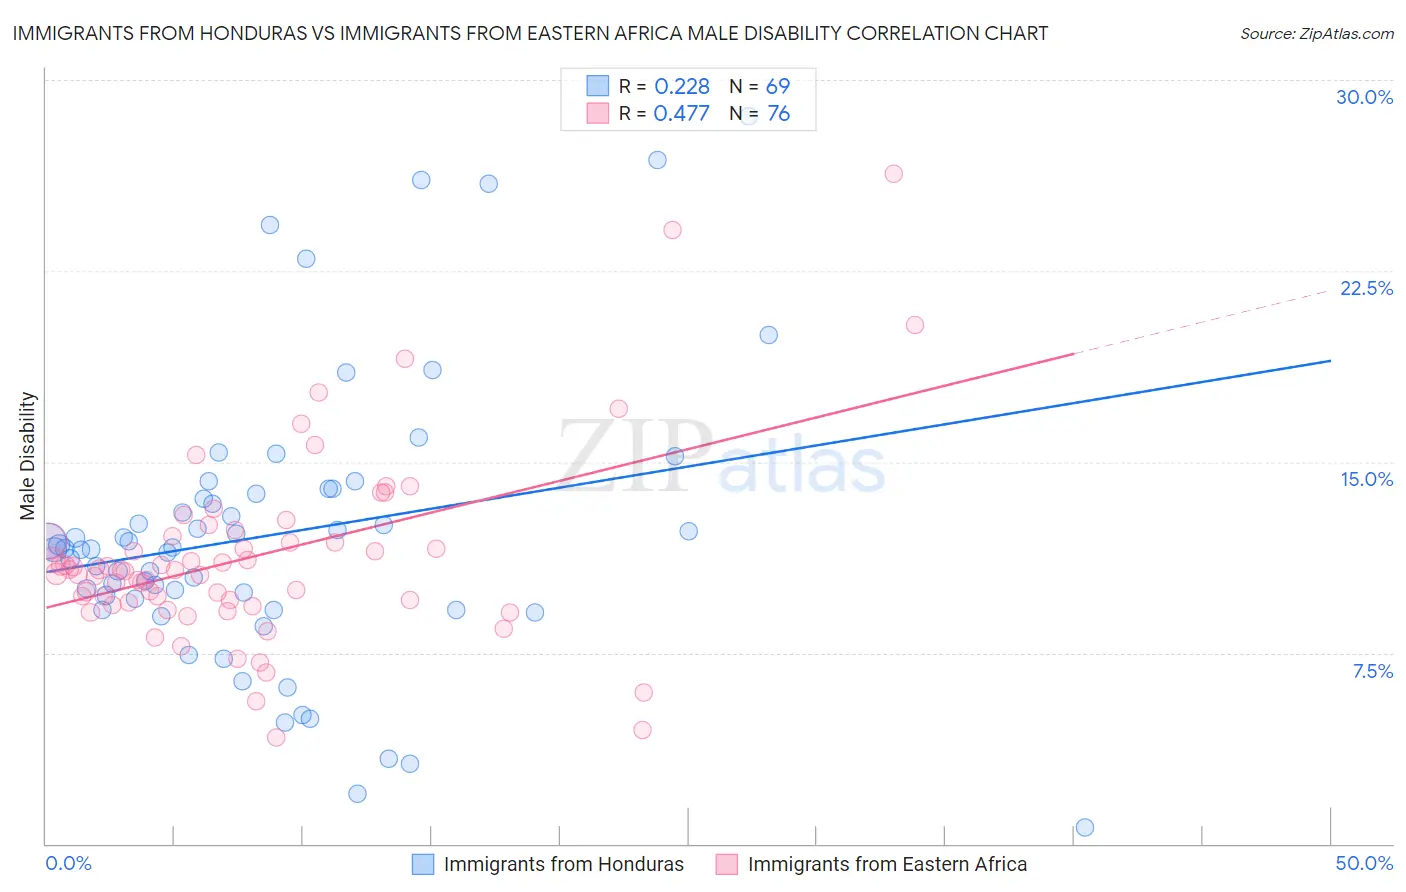
Immigrants from Honduras vs Immigrants from Eastern Africa Male Disability Correlation Chart
The statistical analysis conducted on geographies consisting of 322,552,895 people shows a weak positive correlation between the proportion of Immigrants from Honduras and percentage of males with a disability in the United States with a correlation coefficient (R) of 0.228 and weighted average of 11.2%. Similarly, the statistical analysis conducted on geographies consisting of 355,104,040 people shows a moderate positive correlation between the proportion of Immigrants from Eastern Africa and percentage of males with a disability in the United States with a correlation coefficient (R) of 0.477 and weighted average of 10.8%, a difference of 4.1%.
Male Disability Correlation Summary
| Measurement | Immigrants from Honduras | Immigrants from Eastern Africa |
| Minimum | 0.65% | 4.2% |
| Maximum | 28.6% | 26.3% |
| Range | 27.9% | 22.2% |
| Mean | 12.2% | 11.3% |
| Median | 11.6% | 10.8% |
| Interquartile 25% (IQ1) | 9.4% | 9.5% |
| Interquartile 75% (IQ3) | 13.8% | 12.0% |
| Interquartile Range (IQR) | 4.4% | 2.5% |
| Standard Deviation (Sample) | 5.6% | 3.7% |
| Standard Deviation (Population) | 5.5% | 3.7% |
Similar Demographics by Male Disability
Demographics Similar to Immigrants from Honduras by Male Disability
In terms of male disability, the demographic groups most similar to Immigrants from Honduras are Maltese (11.2%, a difference of 0.070%), Immigrants from Burma/Myanmar (11.2%, a difference of 0.10%), Romanian (11.2%, a difference of 0.12%), Syrian (11.2%, a difference of 0.12%), and Haitian (11.2%, a difference of 0.21%).
| Demographics | Rating | Rank | Male Disability |
| Immigrants | Latin America | 54.0 /100 | #168 | Average 11.2% |
| Barbadians | 53.4 /100 | #169 | Average 11.2% |
| New Zealanders | 52.9 /100 | #170 | Average 11.2% |
| Haitians | 52.5 /100 | #171 | Average 11.2% |
| Romanians | 50.7 /100 | #172 | Average 11.2% |
| Immigrants | Burma/Myanmar | 50.4 /100 | #173 | Average 11.2% |
| Maltese | 50.0 /100 | #174 | Average 11.2% |
| Immigrants | Honduras | 48.7 /100 | #175 | Average 11.2% |
| Syrians | 46.6 /100 | #176 | Average 11.2% |
| Immigrants | Norway | 44.2 /100 | #177 | Average 11.3% |
| Australians | 42.2 /100 | #178 | Average 11.3% |
| Immigrants | Caribbean | 41.4 /100 | #179 | Average 11.3% |
| Hondurans | 41.1 /100 | #180 | Average 11.3% |
| Immigrants | Senegal | 34.4 /100 | #181 | Fair 11.3% |
| Immigrants | Belize | 33.7 /100 | #182 | Fair 11.3% |
Demographics Similar to Immigrants from Eastern Africa by Male Disability
In terms of male disability, the demographic groups most similar to Immigrants from Eastern Africa are Immigrants from Belgium (10.8%, a difference of 0.020%), Immigrants from Uganda (10.8%, a difference of 0.070%), Immigrants (10.8%, a difference of 0.090%), Immigrants from Uruguay (10.8%, a difference of 0.13%), and Immigrants from Syria (10.8%, a difference of 0.18%).
| Demographics | Rating | Rank | Male Disability |
| Immigrants | Kazakhstan | 95.9 /100 | #100 | Exceptional 10.7% |
| Immigrants | Greece | 95.6 /100 | #101 | Exceptional 10.7% |
| Immigrants | Eastern Europe | 95.3 /100 | #102 | Exceptional 10.7% |
| Uruguayans | 95.3 /100 | #103 | Exceptional 10.7% |
| Immigrants | Nigeria | 95.1 /100 | #104 | Exceptional 10.8% |
| Immigrants | Brazil | 95.0 /100 | #105 | Exceptional 10.8% |
| Immigrants | Syria | 94.9 /100 | #106 | Exceptional 10.8% |
| Immigrants | Eastern Africa | 94.3 /100 | #107 | Exceptional 10.8% |
| Immigrants | Belgium | 94.2 /100 | #108 | Exceptional 10.8% |
| Immigrants | Uganda | 94.0 /100 | #109 | Exceptional 10.8% |
| Immigrants | Immigrants | 93.9 /100 | #110 | Exceptional 10.8% |
| Immigrants | Uruguay | 93.8 /100 | #111 | Exceptional 10.8% |
| Ghanaians | 93.4 /100 | #112 | Exceptional 10.8% |
| Immigrants | Zimbabwe | 93.0 /100 | #113 | Exceptional 10.8% |
| Central Americans | 92.7 /100 | #114 | Exceptional 10.8% |