Immigrants from Guatemala vs Immigrants from England Female Disability
COMPARE
Immigrants from Guatemala
Immigrants from England
Female Disability
Female Disability Comparison
Immigrants from Guatemala
Immigrants from England
12.1%
FEMALE DISABILITY
66.0/ 100
METRIC RATING
160th/ 347
METRIC RANK
12.2%
FEMALE DISABILITY
50.0/ 100
METRIC RATING
174th/ 347
METRIC RANK
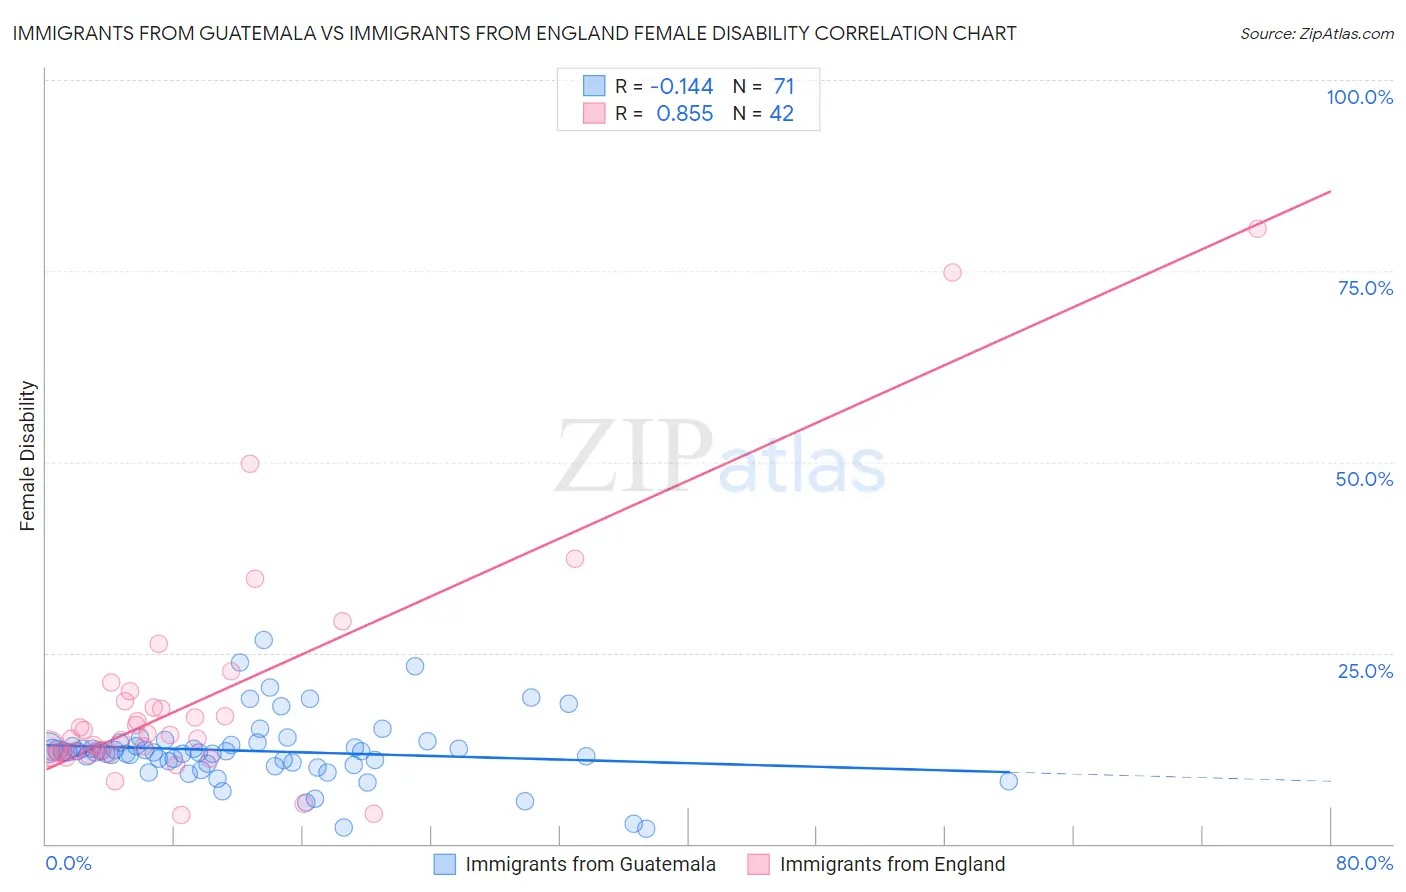
Immigrants from Guatemala vs Immigrants from England Female Disability Correlation Chart
The statistical analysis conducted on geographies consisting of 377,228,850 people shows a poor negative correlation between the proportion of Immigrants from Guatemala and percentage of females with a disability in the United States with a correlation coefficient (R) of -0.144 and weighted average of 12.1%. Similarly, the statistical analysis conducted on geographies consisting of 391,881,475 people shows a very strong positive correlation between the proportion of Immigrants from England and percentage of females with a disability in the United States with a correlation coefficient (R) of 0.855 and weighted average of 12.2%, a difference of 0.63%.
Female Disability Correlation Summary
| Measurement | Immigrants from Guatemala | Immigrants from England |
| Minimum | 2.0% | 3.8% |
| Maximum | 26.6% | 80.5% |
| Range | 24.7% | 76.6% |
| Mean | 12.1% | 19.1% |
| Median | 12.0% | 14.0% |
| Interquartile 25% (IQ1) | 10.5% | 11.9% |
| Interquartile 75% (IQ3) | 12.9% | 18.7% |
| Interquartile Range (IQR) | 2.4% | 6.8% |
| Standard Deviation (Sample) | 4.4% | 15.8% |
| Standard Deviation (Population) | 4.3% | 15.6% |
Demographics Similar to Immigrants from Guatemala and Immigrants from England by Female Disability
In terms of female disability, the demographic groups most similar to Immigrants from Guatemala are Guyanese (12.1%, a difference of 0.060%), Immigrants from Central America (12.1%, a difference of 0.070%), Immigrants from Ukraine (12.1%, a difference of 0.070%), Guatemalan (12.1%, a difference of 0.090%), and Czech (12.1%, a difference of 0.10%). Similarly, the demographic groups most similar to Immigrants from England are Immigrants from St. Vincent and the Grenadines (12.2%, a difference of 0.010%), Immigrants from Mexico (12.2%, a difference of 0.030%), Haitian (12.2%, a difference of 0.070%), Immigrants from Southern Europe (12.2%, a difference of 0.24%), and Maltese (12.2%, a difference of 0.26%).
| Demographics | Rating | Rank | Female Disability |
| Danes | 72.5 /100 | #157 | Good 12.1% |
| Immigrants | Middle Africa | 72.4 /100 | #158 | Good 12.1% |
| Immigrants | Central America | 67.7 /100 | #159 | Good 12.1% |
| Immigrants | Guatemala | 66.0 /100 | #160 | Good 12.1% |
| Guyanese | 64.7 /100 | #161 | Good 12.1% |
| Immigrants | Ukraine | 64.3 /100 | #162 | Good 12.1% |
| Guatemalans | 63.8 /100 | #163 | Good 12.1% |
| Czechs | 63.6 /100 | #164 | Good 12.1% |
| Immigrants | Oceania | 61.8 /100 | #165 | Good 12.1% |
| Lithuanians | 59.5 /100 | #166 | Average 12.2% |
| Immigrants | Latin America | 59.0 /100 | #167 | Average 12.2% |
| Immigrants | Haiti | 58.8 /100 | #168 | Average 12.2% |
| Lebanese | 58.1 /100 | #169 | Average 12.2% |
| Maltese | 57.0 /100 | #170 | Average 12.2% |
| Immigrants | Southern Europe | 56.3 /100 | #171 | Average 12.2% |
| Haitians | 51.9 /100 | #172 | Average 12.2% |
| Immigrants | Mexico | 50.8 /100 | #173 | Average 12.2% |
| Immigrants | England | 50.0 /100 | #174 | Average 12.2% |
| Immigrants | St. Vincent and the Grenadines | 49.7 /100 | #175 | Average 12.2% |
| Immigrants | Guyana | 43.1 /100 | #176 | Average 12.2% |
| Immigrants | Ghana | 42.5 /100 | #177 | Average 12.2% |