Immigrants from England vs Comanche Female Disability

COMPARE

Immigrants from England
Race
Ancestry
AfghanAfricanAlaska NativeAlaskan AthabascanAlbanianAleutAlsatianAmericanApacheArabArapahoArgentineanArmenianAssyrian/Chaldean/SyriacAustralianAustrianBahamianBangladeshiBarbadianBasqueBelgianBelizeanBermudanBhutaneseBlackfeetBolivianBrazilianBritishBritish West IndianBulgarianBurmeseCajunCambodianCanadianCape VerdeanCarpatho RusynCelticCentral AmericanCentral American IndianCherokeeCheyenneChickasawChileanChineseChippewaChoctawColombianColvilleCosta RicanCreeCreekCroatianCrowCubanCypriotCzechCzechoslovakianDanishDelawareDominicanDutchDutch West IndianEastern EuropeanEcuadorianEgyptianEnglishEstonianEthiopianEuropeanFijianFilipinoFinnishFrenchFrench American IndianFrench CanadianGermanGerman RussianGhanaianGreekGuamanian/ChamorroGuatemalanGuyaneseHaitianHmongHonduranHopiHoumaHungarianIcelanderIndian (Asian)IndonesianInupiatIranianIraqiIrishIroquoisIsraeliItalianJamaicanJapaneseJordanianKenyanKiowaKoreanLaotianLatvianLebaneseLiberianLithuanianLumbeeLuxembourgerMacedonianMalaysianMalteseMarshalleseMenomineeMexicanMexican American IndianMongolianMoroccanNative HawaiianNavajoNepaleseNew ZealanderNicaraguanNigerianNorthern EuropeanNorwegianOkinawanOsageOttawaPaiutePakistaniPalestinianPanamanianParaguayanPennsylvania GermanPeruvianPimaPolishPortuguesePotawatomiPuebloPuerto RicanPuget Sound SalishRomanianRussianSalvadoranSamoanScandinavianScotch-IrishScottishSeminoleSenegaleseSerbianShoshoneSierra LeoneanSiouxSlavicSlovakSloveneSomaliSouth AfricanSouth AmericanSouth American IndianSoviet UnionSpaniardSpanishSpanish AmericanSpanish American IndianSri LankanSubsaharan AfricanSudaneseSwedishSwissSyrianTaiwaneseThaiTlingit-HaidaTohono O'OdhamTonganTrinidadian and TobagonianTsimshianTurkishU.S. Virgin IslanderUgandanUkrainianUruguayanUteVenezuelanVietnameseWelshWest IndianYakamaYaquiYugoslavianYumanYup'ikZimbabwean
Immigration
NonimmigrantsImmigrantsAfghanistanAfricaAlbaniaArgentinaArmeniaAsiaAustraliaAustriaBahamasBangladeshBarbadosBelarusBelgiumBelizeBoliviaBosnia and HerzegovinaBrazilBulgariaBurma/MyanmarCabo VerdeCambodiaCameroonCanadaCaribbeanCentral AmericaChileChinaColombiaCongoCosta RicaCroatiaCubaCzechoslovakiaDenmarkDominicaDominican RepublicEastern AfricaEastern AsiaEastern EuropeEcuadorEgyptEl SalvadorEnglandEritreaEthiopiaEuropeFijiFranceGermanyGhanaGreeceGrenadaGuatemalaGuyanaHaitiHondurasHong KongHungaryIndiaIndonesiaIranIraqIrelandIsraelItalyJamaicaJapanJordanKazakhstanKenyaKoreaKuwaitLaosLatin AmericaLatviaLebanonLiberiaLithuaniaMalaysiaMexicoMicronesiaMiddle AfricaMoldovaMoroccoNepalNetherlandsNicaraguaNigeriaNorth AmericaNorth MacedoniaNorthern AfricaNorthern EuropeNorwayOceaniaPakistanPanamaPeruPhilippinesPolandPortugalRomaniaRussiaSaudi ArabiaScotlandSenegalSerbiaSierra LeoneSingaporeSomaliaSouth AfricaSouth AmericaSouth Central AsiaSouth Eastern AsiaSouthern EuropeSpainSri LankaSt. Vincent and the GrenadinesSudanSwedenSwitzerlandSyriaTaiwanThailandTrinidad and TobagoTurkeyUgandaUkraineUruguayUzbekistanVenezuelaVietnamWest IndiesWestern AfricaWestern AsiaWestern EuropeYemenZaireZimbabweAzores
Comanche
Race
Ancestry
AfghanAfricanAlaska NativeAlaskan AthabascanAlbanianAleutAlsatianAmericanApacheArabArapahoArgentineanArmenianAssyrian/Chaldean/SyriacAustralianAustrianBahamianBangladeshiBarbadianBasqueBelgianBelizeanBermudanBhutaneseBlackfeetBolivianBrazilianBritishBritish West IndianBulgarianBurmeseCajunCambodianCanadianCape VerdeanCarpatho RusynCelticCentral AmericanCentral American IndianCherokeeCheyenneChickasawChileanChineseChippewaChoctawColombianColvilleComancheCosta RicanCreeCreekCroatianCrowCubanCypriotCzechCzechoslovakianDanishDelawareDominicanDutchDutch West IndianEastern EuropeanEcuadorianEgyptianEnglishEstonianEthiopianEuropeanFijianFilipinoFinnishFrenchFrench American IndianFrench CanadianGermanGerman RussianGhanaianGreekGuamanian/ChamorroGuatemalanGuyaneseHaitianHmongHonduranHopiHoumaHungarianIcelanderIndian (Asian)IndonesianInupiatIranianIraqiIrishIroquoisIsraeliItalianJamaicanJapaneseJordanianKenyanKiowaKoreanLaotianLatvianLebaneseLiberianLithuanianLumbeeLuxembourgerMacedonianMalaysianMalteseMarshalleseMenomineeMexicanMexican American IndianMongolianMoroccanNative HawaiianNavajoNepaleseNew ZealanderNicaraguanNigerianNorthern EuropeanNorwegianOkinawanOsageOttawaPaiutePakistaniPalestinianPanamanianParaguayanPennsylvania GermanPeruvianPimaPolishPortuguesePotawatomiPuebloPuerto RicanPuget Sound SalishRomanianRussianSalvadoranSamoanScandinavianScotch-IrishScottishSeminoleSenegaleseSerbianShoshoneSierra LeoneanSiouxSlavicSlovakSloveneSomaliSouth AfricanSouth AmericanSouth American IndianSoviet UnionSpaniardSpanishSpanish AmericanSpanish American IndianSri LankanSubsaharan AfricanSudaneseSwedishSwissSyrianTaiwaneseThaiTlingit-HaidaTohono O'OdhamTonganTrinidadian and TobagonianTsimshianTurkishU.S. Virgin IslanderUgandanUkrainianUruguayanUteVenezuelanVietnameseWelshWest IndianYakamaYaquiYugoslavianYumanYup'ikZimbabwean
Immigration
NonimmigrantsImmigrantsAfghanistanAfricaAlbaniaArgentinaArmeniaAsiaAustraliaAustriaBahamasBangladeshBarbadosBelarusBelgiumBelizeBoliviaBosnia and HerzegovinaBrazilBulgariaBurma/MyanmarCabo VerdeCambodiaCameroonCanadaCaribbeanCentral AmericaChileChinaColombiaCongoCosta RicaCroatiaCubaCzechoslovakiaDenmarkDominicaDominican RepublicEastern AfricaEastern AsiaEastern EuropeEcuadorEgyptEl SalvadorEritreaEthiopiaEuropeFijiFranceGermanyGhanaGreeceGrenadaGuatemalaGuyanaHaitiHondurasHong KongHungaryIndiaIndonesiaIranIraqIrelandIsraelItalyJamaicaJapanJordanKazakhstanKenyaKoreaKuwaitLaosLatin AmericaLatviaLebanonLiberiaLithuaniaMalaysiaMexicoMicronesiaMiddle AfricaMoldovaMoroccoNepalNetherlandsNicaraguaNigeriaNorth AmericaNorth MacedoniaNorthern AfricaNorthern EuropeNorwayOceaniaPakistanPanamaPeruPhilippinesPolandPortugalRomaniaRussiaSaudi ArabiaScotlandSenegalSerbiaSierra LeoneSingaporeSomaliaSouth AfricaSouth AmericaSouth Central AsiaSouth Eastern AsiaSouthern EuropeSpainSri LankaSt. Vincent and the GrenadinesSudanSwedenSwitzerlandSyriaTaiwanThailandTrinidad and TobagoTurkeyUgandaUkraineUruguayUzbekistanVenezuelaVietnamWest IndiesWestern AfricaWestern AsiaWestern EuropeYemenZaireZimbabweAzores
Female Disability
Income
Poverty
Unemployment
Labor Participation
Family Structure
Vehicle Availability
Education Level
Disability

Female Disability Comparison

Immigrants from England

Comanche

Average
Tragic
12.2%
FEMALE DISABILITY
50.0/ 100
METRIC RATING
174th/ 347
METRIC RANK
14.2%
FEMALE DISABILITY
0.0/ 100
METRIC RATING
326th/ 347
METRIC RANK

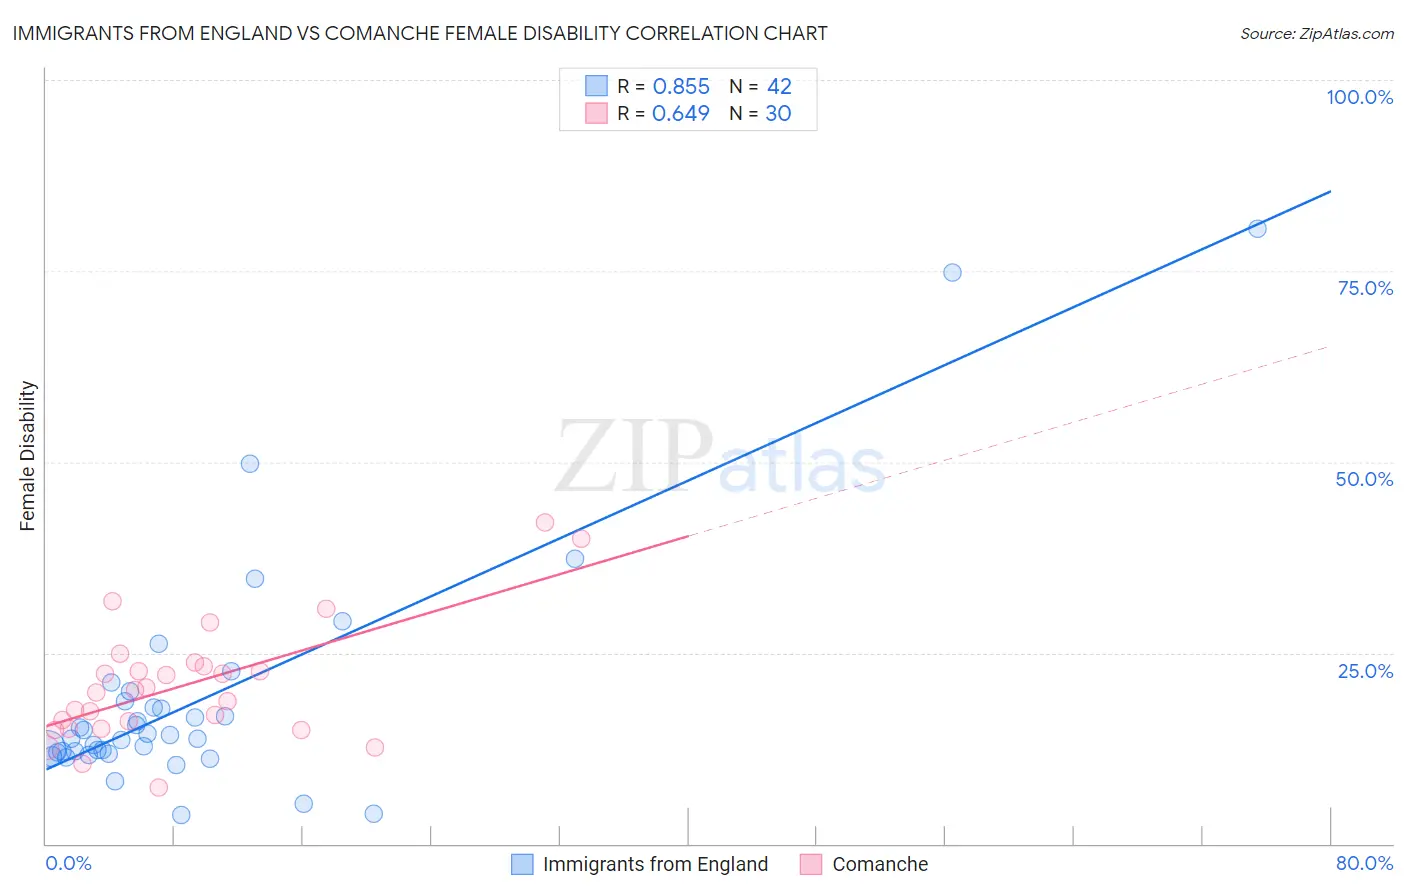
Immigrants from England vs Comanche Female Disability Correlation Chart

The statistical analysis conducted on geographies consisting of 391,881,475 people shows a very strong positive correlation between the proportion of Immigrants from England and percentage of females with a disability in the United States with a correlation coefficient (R) of 0.855 and weighted average of 12.2%. Similarly, the statistical analysis conducted on geographies consisting of 109,776,573 people shows a significant positive correlation between the proportion of Comanche and percentage of females with a disability in the United States with a correlation coefficient (R) of 0.649 and weighted average of 14.2%, a difference of 16.3%.
Immigrants from England vs Comanche Female Disability

Female Disability Correlation Summary

MeasurementImmigrants from EnglandComanche
Minimum3.8%7.4%
Maximum80.5%42.1%
Range76.6%34.7%
Mean19.1%20.8%
Median14.0%20.0%
Interquartile 25% (IQ1)11.9%15.1%
Interquartile 75% (IQ3)18.7%23.2%
Interquartile Range (IQR)6.8%8.1%
Standard Deviation (Sample)15.8%7.9%
Standard Deviation (Population)15.6%7.7%

Similar Demographics by Female Disability

Demographics Similar to Immigrants from England by Female Disability

In terms of female disability, the demographic groups most similar to Immigrants from England are Immigrants from St. Vincent and the Grenadines (12.2%, a difference of 0.010%), Immigrants from Mexico (12.2%, a difference of 0.030%), Haitian (12.2%, a difference of 0.070%), Immigrants from Southern Europe (12.2%, a difference of 0.24%), and Maltese (12.2%, a difference of 0.26%).
DemographicsRating | RankFemale Disability
Immigrants | Latin America
59.0
/100
|
#167
Average
12.2%
Immigrants | Haiti
58.8
/100
|
#168
Average
12.2%
Lebanese
58.1
/100
|
#169
Average
12.2%
Maltese
57.0
/100
|
#170
Average
12.2%
Immigrants | Southern Europe
56.3
/100
|
#171
Average
12.2%
Haitians
51.9
/100
|
#172
Average
12.2%
Immigrants | Mexico
50.8
/100
|
#173
Average
12.2%
Immigrants | England
50.0
/100
|
#174
Average
12.2%
Immigrants | St. Vincent and the Grenadines
49.7
/100
|
#175
Average
12.2%
Immigrants | Guyana
43.1
/100
|
#176
Average
12.2%
Immigrants | Ghana
42.5
/100
|
#177
Average
12.2%
Immigrants | Western Europe
40.9
/100
|
#178
Average
12.2%
Immigrants | Fiji
38.2
/100
|
#179
Fair
12.3%
Albanians
37.9
/100
|
#180
Fair
12.3%
Immigrants | Canada
37.2
/100
|
#181
Fair
12.3%

Demographics Similar to Comanche by Female Disability

In terms of female disability, the demographic groups most similar to Comanche are Navajo (14.2%, a difference of 0.11%), Native/Alaskan (14.1%, a difference of 0.25%), Black/African American (14.1%, a difference of 0.27%), Pueblo (14.1%, a difference of 0.43%), and Potawatomi (14.1%, a difference of 0.44%).
DemographicsRating | RankFemale Disability
Iroquois
0.0
/100
|
#319
Tragic
14.0%
Americans
0.0
/100
|
#320
Tragic
14.1%
Potawatomi
0.0
/100
|
#321
Tragic
14.1%
Pueblo
0.0
/100
|
#322
Tragic
14.1%
Blacks/African Americans
0.0
/100
|
#323
Tragic
14.1%
Natives/Alaskans
0.0
/100
|
#324
Tragic
14.1%
Navajo
0.0
/100
|
#325
Tragic
14.2%
Comanche
0.0
/100
|
#326
Tragic
14.2%
Ottawa
0.0
/100
|
#327
Tragic
14.2%
Cape Verdeans
0.0
/100
|
#328
Tragic
14.2%
Osage
0.0
/100
|
#329
Tragic
14.3%
Yuman
0.0
/100
|
#330
Tragic
14.5%
Immigrants | Cabo Verde
0.0
/100
|
#331
Tragic
14.6%
Pima
0.0
/100
|
#332
Tragic
14.8%
Immigrants | Azores
0.0
/100
|
#333
Tragic
14.9%