Immigrants from Eastern Africa vs Spanish American Indian Female Disability
COMPARE
Immigrants from Eastern Africa
Spanish American Indian
Female Disability
Female Disability Comparison
Immigrants from Eastern Africa
Spanish American Indians
11.7%
FEMALE DISABILITY
98.3/ 100
METRIC RATING
103rd/ 347
METRIC RANK
12.6%
FEMALE DISABILITY
2.1/ 100
METRIC RATING
246th/ 347
METRIC RANK
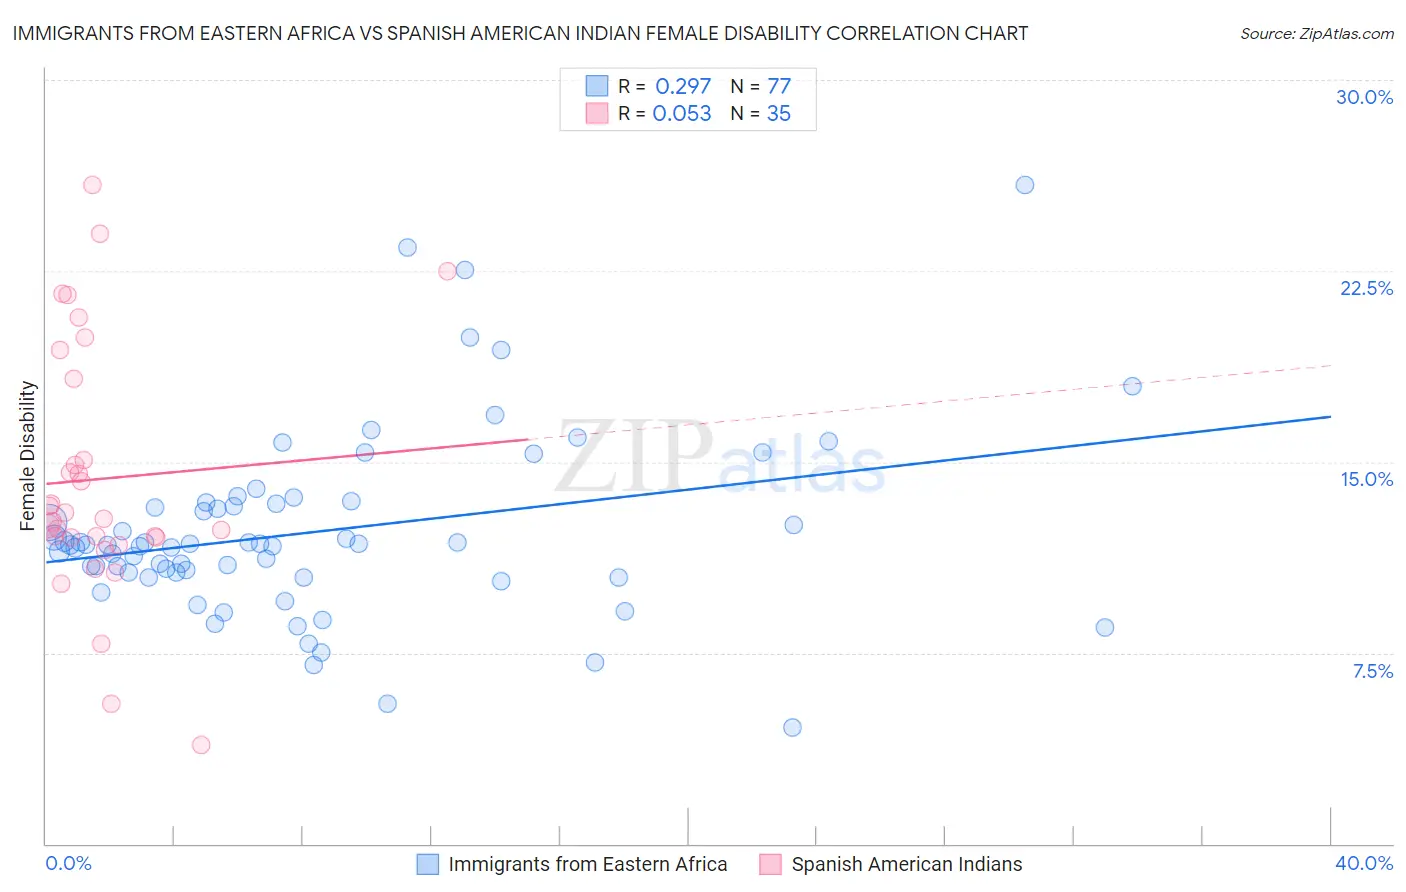
Immigrants from Eastern Africa vs Spanish American Indian Female Disability Correlation Chart
The statistical analysis conducted on geographies consisting of 355,100,411 people shows a weak positive correlation between the proportion of Immigrants from Eastern Africa and percentage of females with a disability in the United States with a correlation coefficient (R) of 0.297 and weighted average of 11.7%. Similarly, the statistical analysis conducted on geographies consisting of 73,149,277 people shows a slight positive correlation between the proportion of Spanish American Indians and percentage of females with a disability in the United States with a correlation coefficient (R) of 0.053 and weighted average of 12.6%, a difference of 7.7%.
Female Disability Correlation Summary
| Measurement | Immigrants from Eastern Africa | Spanish American Indian |
| Minimum | 4.5% | 3.9% |
| Maximum | 25.9% | 25.9% |
| Range | 21.3% | 22.0% |
| Mean | 12.3% | 14.3% |
| Median | 11.7% | 12.7% |
| Interquartile 25% (IQ1) | 10.5% | 12.0% |
| Interquartile 75% (IQ3) | 13.4% | 18.2% |
| Interquartile Range (IQR) | 2.8% | 6.2% |
| Standard Deviation (Sample) | 3.6% | 5.0% |
| Standard Deviation (Population) | 3.6% | 4.9% |
Similar Demographics by Female Disability
Demographics Similar to Immigrants from Eastern Africa by Female Disability
In terms of female disability, the demographic groups most similar to Immigrants from Eastern Africa are Immigrants from Western Asia (11.7%, a difference of 0.010%), Australian (11.7%, a difference of 0.020%), Immigrants from Greece (11.7%, a difference of 0.050%), Immigrants from South Eastern Asia (11.7%, a difference of 0.070%), and Immigrants from Costa Rica (11.7%, a difference of 0.080%).
| Demographics | Rating | Rank | Female Disability |
| Immigrants | Russia | 99.0 /100 | #96 | Exceptional 11.7% |
| Koreans | 99.0 /100 | #97 | Exceptional 11.7% |
| Uruguayans | 98.8 /100 | #98 | Exceptional 11.7% |
| Immigrants | Philippines | 98.6 /100 | #99 | Exceptional 11.7% |
| Immigrants | Uruguay | 98.5 /100 | #100 | Exceptional 11.7% |
| Immigrants | Costa Rica | 98.4 /100 | #101 | Exceptional 11.7% |
| Immigrants | South Eastern Asia | 98.4 /100 | #102 | Exceptional 11.7% |
| Immigrants | Eastern Africa | 98.3 /100 | #103 | Exceptional 11.7% |
| Immigrants | Western Asia | 98.3 /100 | #104 | Exceptional 11.7% |
| Australians | 98.3 /100 | #105 | Exceptional 11.7% |
| Immigrants | Greece | 98.2 /100 | #106 | Exceptional 11.7% |
| Latvians | 98.2 /100 | #107 | Exceptional 11.7% |
| New Zealanders | 98.1 /100 | #108 | Exceptional 11.7% |
| Immigrants | Immigrants | 98.1 /100 | #109 | Exceptional 11.7% |
| Soviet Union | 98.1 /100 | #110 | Exceptional 11.7% |
Demographics Similar to Spanish American Indians by Female Disability
In terms of female disability, the demographic groups most similar to Spanish American Indians are Menominee (12.6%, a difference of 0.010%), Immigrants from Jamaica (12.6%, a difference of 0.020%), Carpatho Rusyn (12.6%, a difference of 0.050%), Alsatian (12.6%, a difference of 0.15%), and Immigrants from Senegal (12.6%, a difference of 0.16%).
| Demographics | Rating | Rank | Female Disability |
| Barbadians | 3.6 /100 | #239 | Tragic 12.6% |
| German Russians | 3.2 /100 | #240 | Tragic 12.6% |
| Japanese | 2.7 /100 | #241 | Tragic 12.6% |
| Canadians | 2.6 /100 | #242 | Tragic 12.6% |
| Immigrants | Senegal | 2.5 /100 | #243 | Tragic 12.6% |
| Alsatians | 2.5 /100 | #244 | Tragic 12.6% |
| Immigrants | Jamaica | 2.2 /100 | #245 | Tragic 12.6% |
| Spanish American Indians | 2.1 /100 | #246 | Tragic 12.6% |
| Menominee | 2.1 /100 | #247 | Tragic 12.6% |
| Carpatho Rusyns | 2.0 /100 | #248 | Tragic 12.6% |
| Immigrants | Congo | 1.8 /100 | #249 | Tragic 12.7% |
| Slovenes | 1.7 /100 | #250 | Tragic 12.7% |
| Crow | 1.6 /100 | #251 | Tragic 12.7% |
| Immigrants | Caribbean | 1.4 /100 | #252 | Tragic 12.7% |
| Jamaicans | 1.4 /100 | #253 | Tragic 12.7% |