Immigrants from Eastern Africa vs Immigrants from Europe Female Disability

COMPARE

Immigrants from Eastern Africa
Race
Ancestry
AfghanAfricanAlaska NativeAlaskan AthabascanAlbanianAleutAlsatianAmericanApacheArabArapahoArgentineanArmenianAssyrian/Chaldean/SyriacAustralianAustrianBahamianBangladeshiBarbadianBasqueBelgianBelizeanBermudanBhutaneseBlackfeetBolivianBrazilianBritishBritish West IndianBulgarianBurmeseCajunCambodianCanadianCape VerdeanCarpatho RusynCelticCentral AmericanCentral American IndianCherokeeCheyenneChickasawChileanChineseChippewaChoctawColombianColvilleComancheCosta RicanCreeCreekCroatianCrowCubanCypriotCzechCzechoslovakianDanishDelawareDominicanDutchDutch West IndianEastern EuropeanEcuadorianEgyptianEnglishEstonianEthiopianEuropeanFijianFilipinoFinnishFrenchFrench American IndianFrench CanadianGermanGerman RussianGhanaianGreekGuamanian/ChamorroGuatemalanGuyaneseHaitianHmongHonduranHopiHoumaHungarianIcelanderIndian (Asian)IndonesianInupiatIranianIraqiIrishIroquoisIsraeliItalianJamaicanJapaneseJordanianKenyanKiowaKoreanLaotianLatvianLebaneseLiberianLithuanianLumbeeLuxembourgerMacedonianMalaysianMalteseMarshalleseMenomineeMexicanMexican American IndianMongolianMoroccanNative HawaiianNavajoNepaleseNew ZealanderNicaraguanNigerianNorthern EuropeanNorwegianOkinawanOsageOttawaPaiutePakistaniPalestinianPanamanianParaguayanPennsylvania GermanPeruvianPimaPolishPortuguesePotawatomiPuebloPuerto RicanPuget Sound SalishRomanianRussianSalvadoranSamoanScandinavianScotch-IrishScottishSeminoleSenegaleseSerbianShoshoneSierra LeoneanSiouxSlavicSlovakSloveneSomaliSouth AfricanSouth AmericanSouth American IndianSoviet UnionSpaniardSpanishSpanish AmericanSpanish American IndianSri LankanSubsaharan AfricanSudaneseSwedishSwissSyrianTaiwaneseThaiTlingit-HaidaTohono O'OdhamTonganTrinidadian and TobagonianTsimshianTurkishU.S. Virgin IslanderUgandanUkrainianUruguayanUteVenezuelanVietnameseWelshWest IndianYakamaYaquiYugoslavianYumanYup'ikZimbabwean
Immigration
NonimmigrantsImmigrantsAfghanistanAfricaAlbaniaArgentinaArmeniaAsiaAustraliaAustriaBahamasBangladeshBarbadosBelarusBelgiumBelizeBoliviaBosnia and HerzegovinaBrazilBulgariaBurma/MyanmarCabo VerdeCambodiaCameroonCanadaCaribbeanCentral AmericaChileChinaColombiaCongoCosta RicaCroatiaCubaCzechoslovakiaDenmarkDominicaDominican RepublicEastern AfricaEastern AsiaEastern EuropeEcuadorEgyptEl SalvadorEnglandEritreaEthiopiaFijiFranceGermanyGhanaGreeceGrenadaGuatemalaGuyanaHaitiHondurasHong KongHungaryIndiaIndonesiaIranIraqIrelandIsraelItalyJamaicaJapanJordanKazakhstanKenyaKoreaKuwaitLaosLatin AmericaLatviaLebanonLiberiaLithuaniaMalaysiaMexicoMicronesiaMiddle AfricaMoldovaMoroccoNepalNetherlandsNicaraguaNigeriaNorth AmericaNorth MacedoniaNorthern AfricaNorthern EuropeNorwayOceaniaPakistanPanamaPeruPhilippinesPolandPortugalRomaniaRussiaSaudi ArabiaScotlandSenegalSerbiaSierra LeoneSingaporeSomaliaSouth AfricaSouth AmericaSouth Central AsiaSouth Eastern AsiaSouthern EuropeSpainSri LankaSt. Vincent and the GrenadinesSudanSwedenSwitzerlandSyriaTaiwanThailandTrinidad and TobagoTurkeyUgandaUkraineUruguayUzbekistanVenezuelaVietnamWest IndiesWestern AfricaWestern AsiaWestern EuropeYemenZaireZimbabweAzores
Immigrants from Europe
Race
Ancestry
AfghanAfricanAlaska NativeAlaskan AthabascanAlbanianAleutAlsatianAmericanApacheArabArapahoArgentineanArmenianAssyrian/Chaldean/SyriacAustralianAustrianBahamianBangladeshiBarbadianBasqueBelgianBelizeanBermudanBhutaneseBlackfeetBolivianBrazilianBritishBritish West IndianBulgarianBurmeseCajunCambodianCanadianCape VerdeanCarpatho RusynCelticCentral AmericanCentral American IndianCherokeeCheyenneChickasawChileanChineseChippewaChoctawColombianColvilleComancheCosta RicanCreeCreekCroatianCrowCubanCypriotCzechCzechoslovakianDanishDelawareDominicanDutchDutch West IndianEastern EuropeanEcuadorianEgyptianEnglishEstonianEthiopianEuropeanFijianFilipinoFinnishFrenchFrench American IndianFrench CanadianGermanGerman RussianGhanaianGreekGuamanian/ChamorroGuatemalanGuyaneseHaitianHmongHonduranHopiHoumaHungarianIcelanderIndian (Asian)IndonesianInupiatIranianIraqiIrishIroquoisIsraeliItalianJamaicanJapaneseJordanianKenyanKiowaKoreanLaotianLatvianLebaneseLiberianLithuanianLumbeeLuxembourgerMacedonianMalaysianMalteseMarshalleseMenomineeMexicanMexican American IndianMongolianMoroccanNative HawaiianNavajoNepaleseNew ZealanderNicaraguanNigerianNorthern EuropeanNorwegianOkinawanOsageOttawaPaiutePakistaniPalestinianPanamanianParaguayanPennsylvania GermanPeruvianPimaPolishPortuguesePotawatomiPuebloPuerto RicanPuget Sound SalishRomanianRussianSalvadoranSamoanScandinavianScotch-IrishScottishSeminoleSenegaleseSerbianShoshoneSierra LeoneanSiouxSlavicSlovakSloveneSomaliSouth AfricanSouth AmericanSouth American IndianSoviet UnionSpaniardSpanishSpanish AmericanSpanish American IndianSri LankanSubsaharan AfricanSudaneseSwedishSwissSyrianTaiwaneseThaiTlingit-HaidaTohono O'OdhamTonganTrinidadian and TobagonianTsimshianTurkishU.S. Virgin IslanderUgandanUkrainianUruguayanUteVenezuelanVietnameseWelshWest IndianYakamaYaquiYugoslavianYumanYup'ikZimbabwean
Immigration
NonimmigrantsImmigrantsAfghanistanAfricaAlbaniaArgentinaArmeniaAsiaAustraliaAustriaBahamasBangladeshBarbadosBelarusBelgiumBelizeBoliviaBosnia and HerzegovinaBrazilBulgariaBurma/MyanmarCabo VerdeCambodiaCameroonCanadaCaribbeanCentral AmericaChileChinaColombiaCongoCosta RicaCroatiaCubaCzechoslovakiaDenmarkDominicaDominican RepublicEastern AsiaEastern EuropeEcuadorEgyptEl SalvadorEnglandEritreaEthiopiaEuropeFijiFranceGermanyGhanaGreeceGrenadaGuatemalaGuyanaHaitiHondurasHong KongHungaryIndiaIndonesiaIranIraqIrelandIsraelItalyJamaicaJapanJordanKazakhstanKenyaKoreaKuwaitLaosLatin AmericaLatviaLebanonLiberiaLithuaniaMalaysiaMexicoMicronesiaMiddle AfricaMoldovaMoroccoNepalNetherlandsNicaraguaNigeriaNorth AmericaNorth MacedoniaNorthern AfricaNorthern EuropeNorwayOceaniaPakistanPanamaPeruPhilippinesPolandPortugalRomaniaRussiaSaudi ArabiaScotlandSenegalSerbiaSierra LeoneSingaporeSomaliaSouth AfricaSouth AmericaSouth Central AsiaSouth Eastern AsiaSouthern EuropeSpainSri LankaSt. Vincent and the GrenadinesSudanSwedenSwitzerlandSyriaTaiwanThailandTrinidad and TobagoTurkeyUgandaUkraineUruguayUzbekistanVenezuelaVietnamWest IndiesWestern AfricaWestern AsiaWestern EuropeYemenZaireZimbabweAzores
Female Disability
Income
Poverty
Unemployment
Labor Participation
Family Structure
Vehicle Availability
Education Level
Disability

Female Disability Comparison

Immigrants from Eastern Africa

Immigrants from Europe

Exceptional
Exceptional
11.7%
FEMALE DISABILITY
98.3/ 100
METRIC RATING
103rd/ 347
METRIC RANK
11.8%
FEMALE DISABILITY
96.2/ 100
METRIC RATING
126th/ 347
METRIC RANK

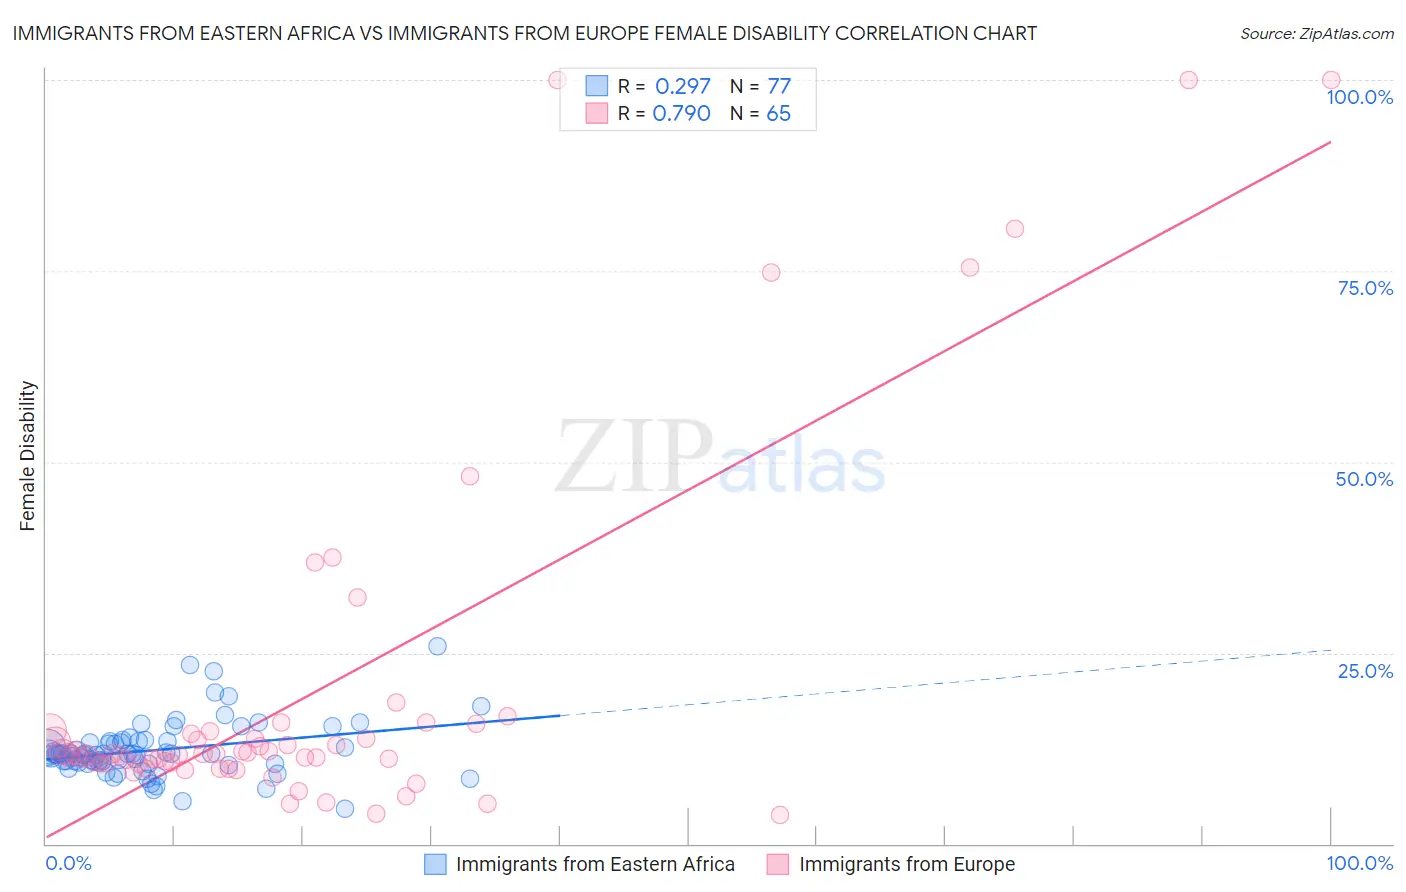
Immigrants from Eastern Africa vs Immigrants from Europe Female Disability Correlation Chart

The statistical analysis conducted on geographies consisting of 355,100,411 people shows a weak positive correlation between the proportion of Immigrants from Eastern Africa and percentage of females with a disability in the United States with a correlation coefficient (R) of 0.297 and weighted average of 11.7%. Similarly, the statistical analysis conducted on geographies consisting of 547,243,236 people shows a strong positive correlation between the proportion of Immigrants from Europe and percentage of females with a disability in the United States with a correlation coefficient (R) of 0.790 and weighted average of 11.8%, a difference of 0.82%.
Immigrants from Eastern Africa vs Immigrants from Europe Female Disability

Female Disability Correlation Summary

MeasurementImmigrants from Eastern AfricaImmigrants from Europe
Minimum4.5%3.8%
Maximum25.9%100.0%
Range21.3%96.2%
Mean12.3%20.0%
Median11.7%11.8%
Interquartile 25% (IQ1)10.5%10.5%
Interquartile 75% (IQ3)13.4%14.8%
Interquartile Range (IQR)2.8%4.3%
Standard Deviation (Sample)3.6%23.5%
Standard Deviation (Population)3.6%23.3%

Similar Demographics by Female Disability

Demographics Similar to Immigrants from Eastern Africa by Female Disability

In terms of female disability, the demographic groups most similar to Immigrants from Eastern Africa are Immigrants from Western Asia (11.7%, a difference of 0.010%), Australian (11.7%, a difference of 0.020%), Immigrants from Greece (11.7%, a difference of 0.050%), Immigrants from South Eastern Asia (11.7%, a difference of 0.070%), and Immigrants from Costa Rica (11.7%, a difference of 0.080%).
DemographicsRating | RankFemale Disability
Immigrants | Russia
99.0
/100
|
#96
Exceptional
11.7%
Koreans
99.0
/100
|
#97
Exceptional
11.7%
Uruguayans
98.8
/100
|
#98
Exceptional
11.7%
Immigrants | Philippines
98.6
/100
|
#99
Exceptional
11.7%
Immigrants | Uruguay
98.5
/100
|
#100
Exceptional
11.7%
Immigrants | Costa Rica
98.4
/100
|
#101
Exceptional
11.7%
Immigrants | South Eastern Asia
98.4
/100
|
#102
Exceptional
11.7%
Immigrants | Eastern Africa
98.3
/100
|
#103
Exceptional
11.7%
Immigrants | Western Asia
98.3
/100
|
#104
Exceptional
11.7%
Australians
98.3
/100
|
#105
Exceptional
11.7%
Immigrants | Greece
98.2
/100
|
#106
Exceptional
11.7%
Latvians
98.2
/100
|
#107
Exceptional
11.7%
New Zealanders
98.1
/100
|
#108
Exceptional
11.7%
Immigrants | Immigrants
98.1
/100
|
#109
Exceptional
11.7%
Soviet Union
98.1
/100
|
#110
Exceptional
11.7%

Demographics Similar to Immigrants from Europe by Female Disability

In terms of female disability, the demographic groups most similar to Immigrants from Europe are Immigrants from Italy (11.8%, a difference of 0.060%), Russian (11.8%, a difference of 0.090%), South American Indian (11.8%, a difference of 0.10%), Immigrants from Croatia (11.8%, a difference of 0.14%), and Immigrants from Latvia (11.8%, a difference of 0.14%).
DemographicsRating | RankFemale Disability
Immigrants | Uganda
97.2
/100
|
#119
Exceptional
11.8%
Immigrants | Kazakhstan
97.0
/100
|
#120
Exceptional
11.8%
Immigrants | Netherlands
96.9
/100
|
#121
Exceptional
11.8%
Immigrants | North Macedonia
96.8
/100
|
#122
Exceptional
11.8%
Immigrants | Croatia
96.7
/100
|
#123
Exceptional
11.8%
Russians
96.5
/100
|
#124
Exceptional
11.8%
Immigrants | Italy
96.4
/100
|
#125
Exceptional
11.8%
Immigrants | Europe
96.2
/100
|
#126
Exceptional
11.8%
South American Indians
95.8
/100
|
#127
Exceptional
11.8%
Immigrants | Latvia
95.6
/100
|
#128
Exceptional
11.8%
Macedonians
95.5
/100
|
#129
Exceptional
11.8%
Nicaraguans
95.2
/100
|
#130
Exceptional
11.9%
Arabs
95.1
/100
|
#131
Exceptional
11.9%
Immigrants | Syria
94.6
/100
|
#132
Exceptional
11.9%
Kenyans
94.5
/100
|
#133
Exceptional
11.9%