Immigrants from Central America vs Egyptian Female Disability

COMPARE

Immigrants from Central America
Race
Ancestry
AfghanAfricanAlaska NativeAlaskan AthabascanAlbanianAleutAlsatianAmericanApacheArabArapahoArgentineanArmenianAssyrian/Chaldean/SyriacAustralianAustrianBahamianBangladeshiBarbadianBasqueBelgianBelizeanBermudanBhutaneseBlackfeetBolivianBrazilianBritishBritish West IndianBulgarianBurmeseCajunCambodianCanadianCape VerdeanCarpatho RusynCelticCentral AmericanCentral American IndianCherokeeCheyenneChickasawChileanChineseChippewaChoctawColombianColvilleComancheCosta RicanCreeCreekCroatianCrowCubanCypriotCzechCzechoslovakianDanishDelawareDominicanDutchDutch West IndianEastern EuropeanEcuadorianEnglishEstonianEthiopianEuropeanFijianFilipinoFinnishFrenchFrench American IndianFrench CanadianGermanGerman RussianGhanaianGreekGuamanian/ChamorroGuatemalanGuyaneseHaitianHmongHonduranHopiHoumaHungarianIcelanderIndian (Asian)IndonesianInupiatIranianIraqiIrishIroquoisIsraeliItalianJamaicanJapaneseJordanianKenyanKiowaKoreanLaotianLatvianLebaneseLiberianLithuanianLumbeeLuxembourgerMacedonianMalaysianMalteseMarshalleseMenomineeMexicanMexican American IndianMongolianMoroccanNative HawaiianNavajoNepaleseNew ZealanderNicaraguanNigerianNorthern EuropeanNorwegianOkinawanOsageOttawaPaiutePakistaniPalestinianPanamanianParaguayanPennsylvania GermanPeruvianPimaPolishPortuguesePotawatomiPuebloPuerto RicanPuget Sound SalishRomanianRussianSalvadoranSamoanScandinavianScotch-IrishScottishSeminoleSenegaleseSerbianShoshoneSierra LeoneanSiouxSlavicSlovakSloveneSomaliSouth AfricanSouth AmericanSouth American IndianSoviet UnionSpaniardSpanishSpanish AmericanSpanish American IndianSri LankanSubsaharan AfricanSudaneseSwedishSwissSyrianTaiwaneseThaiTlingit-HaidaTohono O'OdhamTonganTrinidadian and TobagonianTsimshianTurkishU.S. Virgin IslanderUgandanUkrainianUruguayanUteVenezuelanVietnameseWelshWest IndianYakamaYaquiYugoslavianYumanYup'ikZimbabwean
Immigration
NonimmigrantsImmigrantsAfghanistanAfricaAlbaniaArgentinaArmeniaAsiaAustraliaAustriaBahamasBangladeshBarbadosBelarusBelgiumBelizeBoliviaBosnia and HerzegovinaBrazilBulgariaBurma/MyanmarCabo VerdeCambodiaCameroonCanadaCaribbeanCentral AmericaChileChinaColombiaCongoCosta RicaCroatiaCubaCzechoslovakiaDenmarkDominicaDominican RepublicEastern AfricaEastern AsiaEastern EuropeEcuadorEgyptEl SalvadorEnglandEritreaEthiopiaEuropeFijiFranceGermanyGhanaGreeceGrenadaGuatemalaGuyanaHaitiHondurasHong KongHungaryIndiaIndonesiaIranIraqIrelandIsraelItalyJamaicaJapanJordanKazakhstanKenyaKoreaKuwaitLaosLatin AmericaLatviaLebanonLiberiaLithuaniaMalaysiaMexicoMicronesiaMiddle AfricaMoldovaMoroccoNepalNetherlandsNicaraguaNigeriaNorth AmericaNorth MacedoniaNorthern AfricaNorthern EuropeNorwayOceaniaPakistanPanamaPeruPhilippinesPolandPortugalRomaniaRussiaSaudi ArabiaScotlandSenegalSerbiaSierra LeoneSingaporeSomaliaSouth AfricaSouth AmericaSouth Central AsiaSouth Eastern AsiaSouthern EuropeSpainSri LankaSt. Vincent and the GrenadinesSudanSwedenSwitzerlandSyriaTaiwanThailandTrinidad and TobagoTurkeyUgandaUkraineUruguayUzbekistanVenezuelaVietnamWest IndiesWestern AfricaWestern AsiaWestern EuropeYemenZaireZimbabweAzores
Egyptian
Race
Ancestry
AfghanAfricanAlaska NativeAlaskan AthabascanAlbanianAleutAlsatianAmericanApacheArabArapahoArgentineanArmenianAssyrian/Chaldean/SyriacAustralianAustrianBahamianBangladeshiBarbadianBasqueBelgianBelizeanBermudanBhutaneseBlackfeetBolivianBrazilianBritishBritish West IndianBulgarianBurmeseCajunCambodianCanadianCape VerdeanCarpatho RusynCelticCentral AmericanCentral American IndianCherokeeCheyenneChickasawChileanChineseChippewaChoctawColombianColvilleComancheCosta RicanCreeCreekCroatianCrowCubanCypriotCzechCzechoslovakianDanishDelawareDominicanDutchDutch West IndianEastern EuropeanEcuadorianEgyptianEnglishEstonianEthiopianEuropeanFijianFilipinoFinnishFrenchFrench American IndianFrench CanadianGermanGerman RussianGhanaianGreekGuamanian/ChamorroGuatemalanGuyaneseHaitianHmongHonduranHopiHoumaHungarianIcelanderIndian (Asian)IndonesianInupiatIranianIraqiIrishIroquoisIsraeliItalianJamaicanJapaneseJordanianKenyanKiowaKoreanLaotianLatvianLebaneseLiberianLithuanianLumbeeLuxembourgerMacedonianMalaysianMalteseMarshalleseMenomineeMexicanMexican American IndianMongolianMoroccanNative HawaiianNavajoNepaleseNew ZealanderNicaraguanNigerianNorthern EuropeanNorwegianOkinawanOsageOttawaPaiutePakistaniPalestinianPanamanianParaguayanPennsylvania GermanPeruvianPimaPolishPortuguesePotawatomiPuebloPuerto RicanPuget Sound SalishRomanianRussianSalvadoranSamoanScandinavianScotch-IrishScottishSeminoleSenegaleseSerbianShoshoneSierra LeoneanSiouxSlavicSlovakSloveneSomaliSouth AfricanSouth AmericanSouth American IndianSoviet UnionSpaniardSpanishSpanish AmericanSpanish American IndianSri LankanSubsaharan AfricanSudaneseSwedishSwissSyrianTaiwaneseThaiTlingit-HaidaTohono O'OdhamTonganTrinidadian and TobagonianTsimshianTurkishU.S. Virgin IslanderUgandanUkrainianUruguayanUteVenezuelanVietnameseWelshWest IndianYakamaYaquiYugoslavianYumanYup'ikZimbabwean
Immigration
NonimmigrantsImmigrantsAfghanistanAfricaAlbaniaArgentinaArmeniaAsiaAustraliaAustriaBahamasBangladeshBarbadosBelarusBelgiumBelizeBoliviaBosnia and HerzegovinaBrazilBulgariaBurma/MyanmarCabo VerdeCambodiaCameroonCanadaCaribbeanChileChinaColombiaCongoCosta RicaCroatiaCubaCzechoslovakiaDenmarkDominicaDominican RepublicEastern AfricaEastern AsiaEastern EuropeEcuadorEgyptEl SalvadorEnglandEritreaEthiopiaEuropeFijiFranceGermanyGhanaGreeceGrenadaGuatemalaGuyanaHaitiHondurasHong KongHungaryIndiaIndonesiaIranIraqIrelandIsraelItalyJamaicaJapanJordanKazakhstanKenyaKoreaKuwaitLaosLatin AmericaLatviaLebanonLiberiaLithuaniaMalaysiaMexicoMicronesiaMiddle AfricaMoldovaMoroccoNepalNetherlandsNicaraguaNigeriaNorth AmericaNorth MacedoniaNorthern AfricaNorthern EuropeNorwayOceaniaPakistanPanamaPeruPhilippinesPolandPortugalRomaniaRussiaSaudi ArabiaScotlandSenegalSerbiaSierra LeoneSingaporeSomaliaSouth AfricaSouth AmericaSouth Central AsiaSouth Eastern AsiaSouthern EuropeSpainSri LankaSt. Vincent and the GrenadinesSudanSwedenSwitzerlandSyriaTaiwanThailandTrinidad and TobagoTurkeyUgandaUkraineUruguayUzbekistanVenezuelaVietnamWest IndiesWestern AfricaWestern AsiaWestern EuropeYemenZaireZimbabweAzores
Female Disability
Income
Poverty
Unemployment
Labor Participation
Family Structure
Vehicle Availability
Education Level
Disability

Female Disability Comparison

Immigrants from Central America

Egyptians

Good
Exceptional
12.1%
FEMALE DISABILITY
67.7/ 100
METRIC RATING
159th/ 347
METRIC RANK
11.1%
FEMALE DISABILITY
100.0/ 100
METRIC RATING
28th/ 347
METRIC RANK

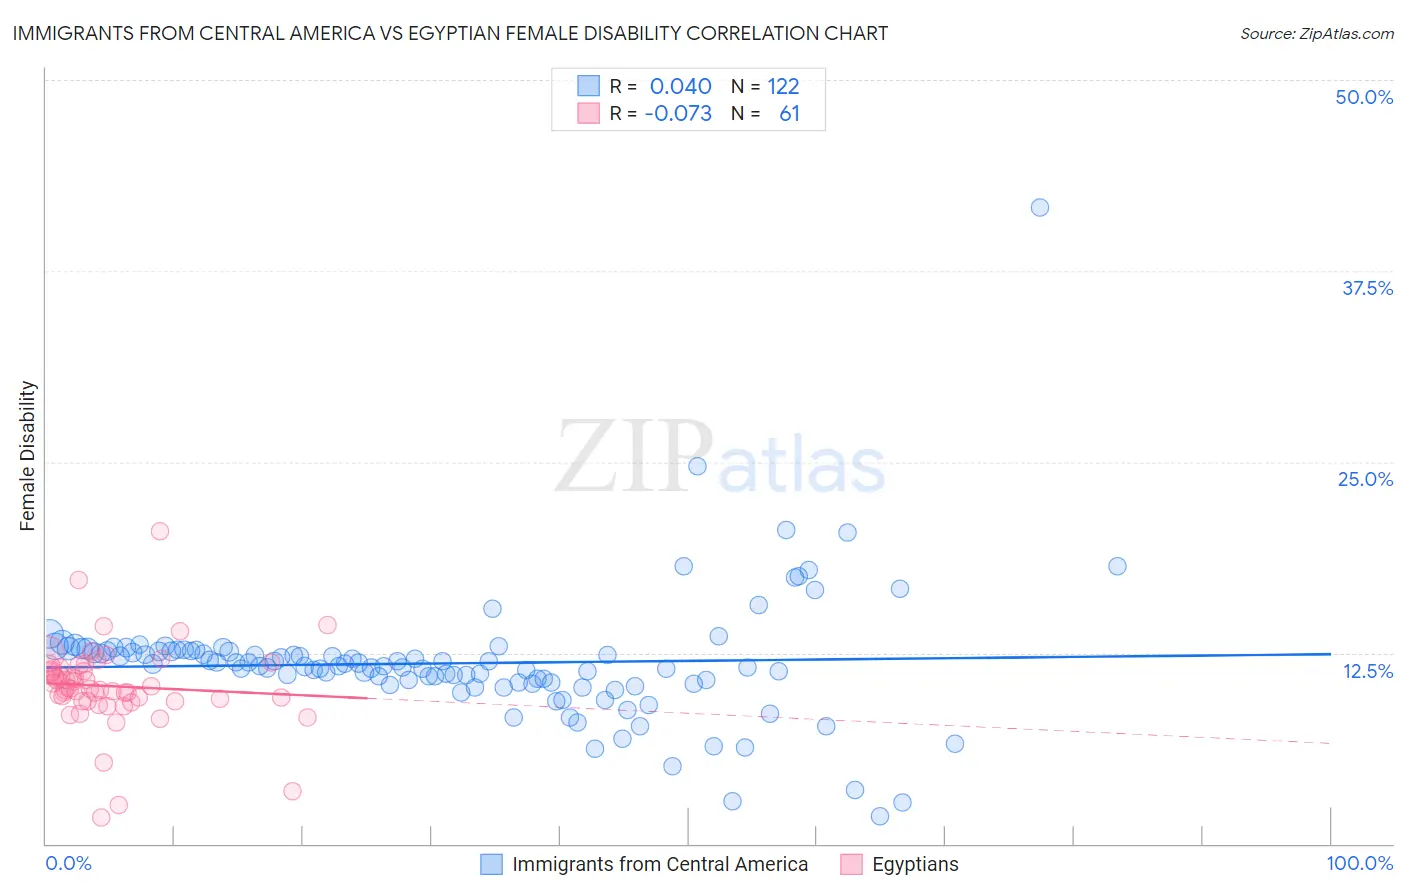
Immigrants from Central America vs Egyptian Female Disability Correlation Chart

The statistical analysis conducted on geographies consisting of 536,290,679 people shows no correlation between the proportion of Immigrants from Central America and percentage of females with a disability in the United States with a correlation coefficient (R) of 0.040 and weighted average of 12.1%. Similarly, the statistical analysis conducted on geographies consisting of 276,904,353 people shows a slight negative correlation between the proportion of Egyptians and percentage of females with a disability in the United States with a correlation coefficient (R) of -0.073 and weighted average of 11.1%, a difference of 9.2%.
Immigrants from Central America vs Egyptian Female Disability

Female Disability Correlation Summary

MeasurementImmigrants from Central AmericaEgyptian
Minimum1.8%1.7%
Maximum41.7%20.5%
Range39.9%18.8%
Mean11.8%10.3%
Median11.7%10.2%
Interquartile 25% (IQ1)10.6%9.3%
Interquartile 75% (IQ3)12.6%11.4%
Interquartile Range (IQR)2.1%2.1%
Standard Deviation (Sample)4.2%2.8%
Standard Deviation (Population)4.2%2.8%

Similar Demographics by Female Disability

Demographics Similar to Immigrants from Central America by Female Disability

In terms of female disability, the demographic groups most similar to Immigrants from Central America are Immigrants from Guatemala (12.1%, a difference of 0.070%), Guyanese (12.1%, a difference of 0.13%), Immigrants from Ukraine (12.1%, a difference of 0.14%), Guatemalan (12.1%, a difference of 0.16%), and Czech (12.1%, a difference of 0.17%).
DemographicsRating | RankFemale Disability
Immigrants | Scotland
79.3
/100
|
#152
Good
12.0%
Sudanese
79.1
/100
|
#153
Good
12.0%
Syrians
76.9
/100
|
#154
Good
12.1%
Ghanaians
76.6
/100
|
#155
Good
12.1%
Moroccans
72.9
/100
|
#156
Good
12.1%
Danes
72.5
/100
|
#157
Good
12.1%
Immigrants | Middle Africa
72.4
/100
|
#158
Good
12.1%
Immigrants | Central America
67.7
/100
|
#159
Good
12.1%
Immigrants | Guatemala
66.0
/100
|
#160
Good
12.1%
Guyanese
64.7
/100
|
#161
Good
12.1%
Immigrants | Ukraine
64.3
/100
|
#162
Good
12.1%
Guatemalans
63.8
/100
|
#163
Good
12.1%
Czechs
63.6
/100
|
#164
Good
12.1%
Immigrants | Oceania
61.8
/100
|
#165
Good
12.1%
Lithuanians
59.5
/100
|
#166
Average
12.2%

Demographics Similar to Egyptians by Female Disability

In terms of female disability, the demographic groups most similar to Egyptians are Immigrants from Malaysia (11.1%, a difference of 0.060%), Turkish (11.1%, a difference of 0.070%), Immigrants from Kuwait (11.1%, a difference of 0.17%), Immigrants from Turkey (11.1%, a difference of 0.27%), and Immigrants from Australia (11.1%, a difference of 0.33%).
DemographicsRating | RankFemale Disability
Asians
100.0
/100
|
#21
Exceptional
10.9%
Immigrants | Sri Lanka
100.0
/100
|
#22
Exceptional
10.9%
Venezuelans
100.0
/100
|
#23
Exceptional
11.0%
Immigrants | Argentina
100.0
/100
|
#24
Exceptional
11.0%
Immigrants | Asia
100.0
/100
|
#25
Exceptional
11.0%
Argentineans
100.0
/100
|
#26
Exceptional
11.0%
Immigrants | Turkey
100.0
/100
|
#27
Exceptional
11.1%
Egyptians
100.0
/100
|
#28
Exceptional
11.1%
Immigrants | Malaysia
100.0
/100
|
#29
Exceptional
11.1%
Turks
100.0
/100
|
#30
Exceptional
11.1%
Immigrants | Kuwait
100.0
/100
|
#31
Exceptional
11.1%
Immigrants | Australia
100.0
/100
|
#32
Exceptional
11.1%
Immigrants | Egypt
100.0
/100
|
#33
Exceptional
11.1%
Immigrants | Indonesia
100.0
/100
|
#34
Exceptional
11.2%
Immigrants | Japan
100.0
/100
|
#35
Exceptional
11.2%