Immigrants from Bangladesh vs Peruvian Female Disability
COMPARE
Immigrants from Bangladesh
Peruvian
Female Disability
Female Disability Comparison
Immigrants from Bangladesh
Peruvians
11.8%
FEMALE DISABILITY
97.8/ 100
METRIC RATING
112th/ 347
METRIC RANK
11.3%
FEMALE DISABILITY
99.9/ 100
METRIC RATING
54th/ 347
METRIC RANK
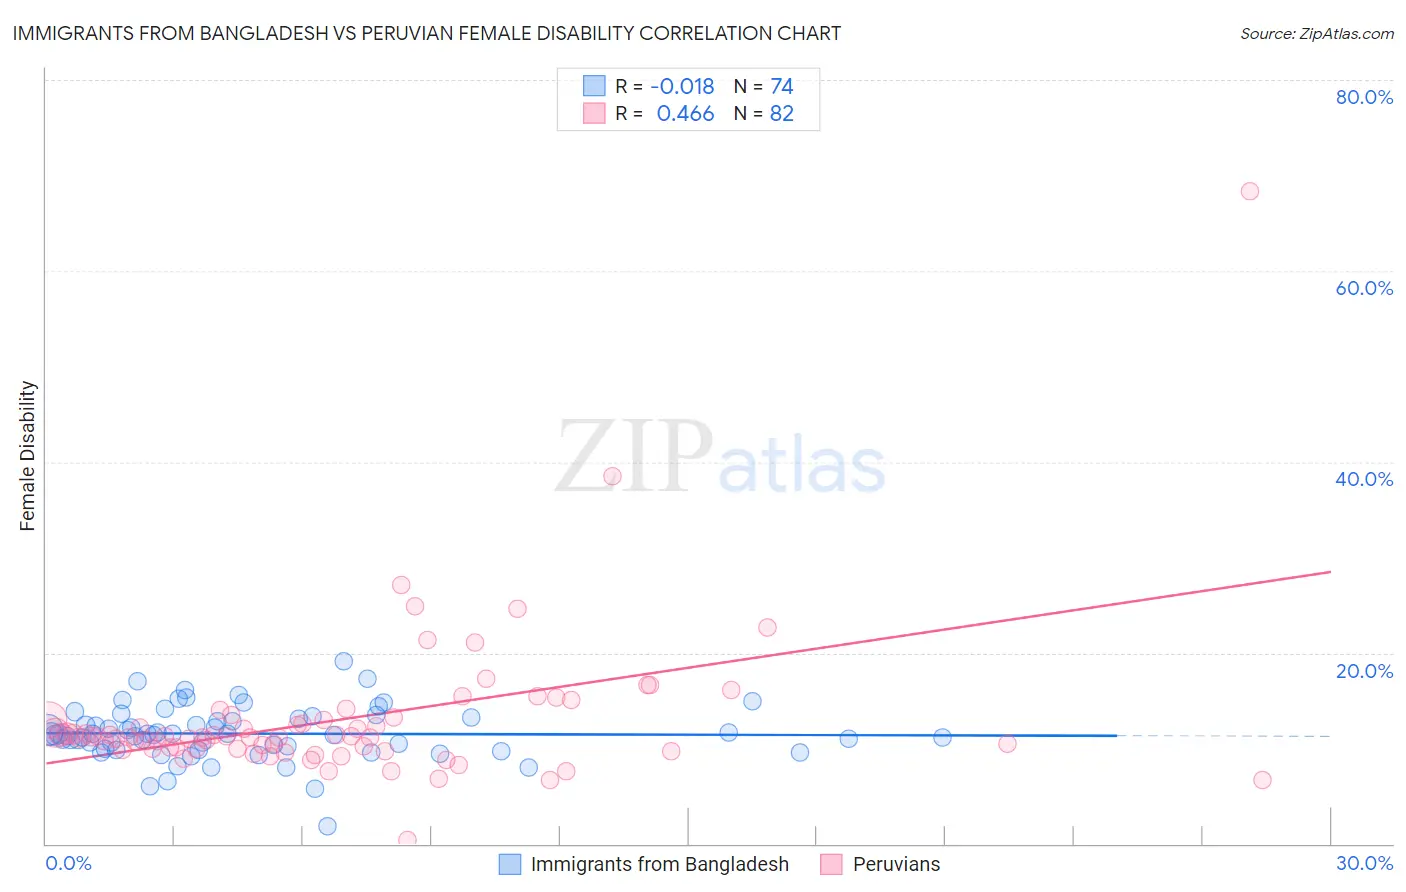
Immigrants from Bangladesh vs Peruvian Female Disability Correlation Chart
The statistical analysis conducted on geographies consisting of 203,667,560 people shows no correlation between the proportion of Immigrants from Bangladesh and percentage of females with a disability in the United States with a correlation coefficient (R) of -0.018 and weighted average of 11.8%. Similarly, the statistical analysis conducted on geographies consisting of 363,181,047 people shows a moderate positive correlation between the proportion of Peruvians and percentage of females with a disability in the United States with a correlation coefficient (R) of 0.466 and weighted average of 11.3%, a difference of 3.7%.
Female Disability Correlation Summary
| Measurement | Immigrants from Bangladesh | Peruvian |
| Minimum | 1.8% | 0.45% |
| Maximum | 19.1% | 68.3% |
| Range | 17.3% | 67.8% |
| Mean | 11.5% | 13.0% |
| Median | 11.4% | 11.2% |
| Interquartile 25% (IQ1) | 10.0% | 9.9% |
| Interquartile 75% (IQ3) | 13.1% | 13.0% |
| Interquartile Range (IQR) | 3.2% | 3.1% |
| Standard Deviation (Sample) | 2.8% | 8.0% |
| Standard Deviation (Population) | 2.8% | 8.0% |
Similar Demographics by Female Disability
Demographics Similar to Immigrants from Bangladesh by Female Disability
In terms of female disability, the demographic groups most similar to Immigrants from Bangladesh are Immigrants from Belarus (11.8%, a difference of 0.010%), South African (11.8%, a difference of 0.040%), Brazilian (11.8%, a difference of 0.040%), Immigrants from Morocco (11.8%, a difference of 0.090%), and Costa Rican (11.7%, a difference of 0.12%).
| Demographics | Rating | Rank | Female Disability |
| Australians | 98.3 /100 | #105 | Exceptional 11.7% |
| Immigrants | Greece | 98.2 /100 | #106 | Exceptional 11.7% |
| Latvians | 98.2 /100 | #107 | Exceptional 11.7% |
| New Zealanders | 98.1 /100 | #108 | Exceptional 11.7% |
| Immigrants | Immigrants | 98.1 /100 | #109 | Exceptional 11.7% |
| Soviet Union | 98.1 /100 | #110 | Exceptional 11.7% |
| Costa Ricans | 98.1 /100 | #111 | Exceptional 11.7% |
| Immigrants | Bangladesh | 97.8 /100 | #112 | Exceptional 11.8% |
| Immigrants | Belarus | 97.8 /100 | #113 | Exceptional 11.8% |
| South Africans | 97.7 /100 | #114 | Exceptional 11.8% |
| Brazilians | 97.7 /100 | #115 | Exceptional 11.8% |
| Immigrants | Morocco | 97.6 /100 | #116 | Exceptional 11.8% |
| Immigrants | Eastern Europe | 97.2 /100 | #117 | Exceptional 11.8% |
| Immigrants | Nigeria | 97.2 /100 | #118 | Exceptional 11.8% |
| Immigrants | Uganda | 97.2 /100 | #119 | Exceptional 11.8% |
Demographics Similar to Peruvians by Female Disability
In terms of female disability, the demographic groups most similar to Peruvians are Bulgarian (11.3%, a difference of 0.020%), Immigrants from Saudi Arabia (11.3%, a difference of 0.060%), Immigrants from Peru (11.3%, a difference of 0.10%), Immigrants from Belgium (11.3%, a difference of 0.22%), and Taiwanese (11.4%, a difference of 0.25%).
| Demographics | Rating | Rank | Female Disability |
| Jordanians | 100.0 /100 | #47 | Exceptional 11.3% |
| Zimbabweans | 100.0 /100 | #48 | Exceptional 11.3% |
| Tongans | 100.0 /100 | #49 | Exceptional 11.3% |
| Inupiat | 100.0 /100 | #50 | Exceptional 11.3% |
| Immigrants | Belgium | 100.0 /100 | #51 | Exceptional 11.3% |
| Immigrants | Peru | 99.9 /100 | #52 | Exceptional 11.3% |
| Immigrants | Saudi Arabia | 99.9 /100 | #53 | Exceptional 11.3% |
| Peruvians | 99.9 /100 | #54 | Exceptional 11.3% |
| Bulgarians | 99.9 /100 | #55 | Exceptional 11.3% |
| Taiwanese | 99.9 /100 | #56 | Exceptional 11.4% |
| South Americans | 99.9 /100 | #57 | Exceptional 11.4% |
| Laotians | 99.9 /100 | #58 | Exceptional 11.4% |
| Immigrants | Spain | 99.9 /100 | #59 | Exceptional 11.4% |
| Immigrants | Bulgaria | 99.9 /100 | #60 | Exceptional 11.4% |
| Immigrants | France | 99.9 /100 | #61 | Exceptional 11.4% |