German vs Nigerian Disability Age 18 to 34
COMPARE
German
Nigerian
Disability Age 18 to 34
Disability Age 18 to 34 Comparison
Germans
Nigerians
7.7%
DISABILITY AGE 18 TO 34
0.0/ 100
METRIC RATING
299th/ 347
METRIC RANK
6.6%
DISABILITY AGE 18 TO 34
43.7/ 100
METRIC RATING
178th/ 347
METRIC RANK
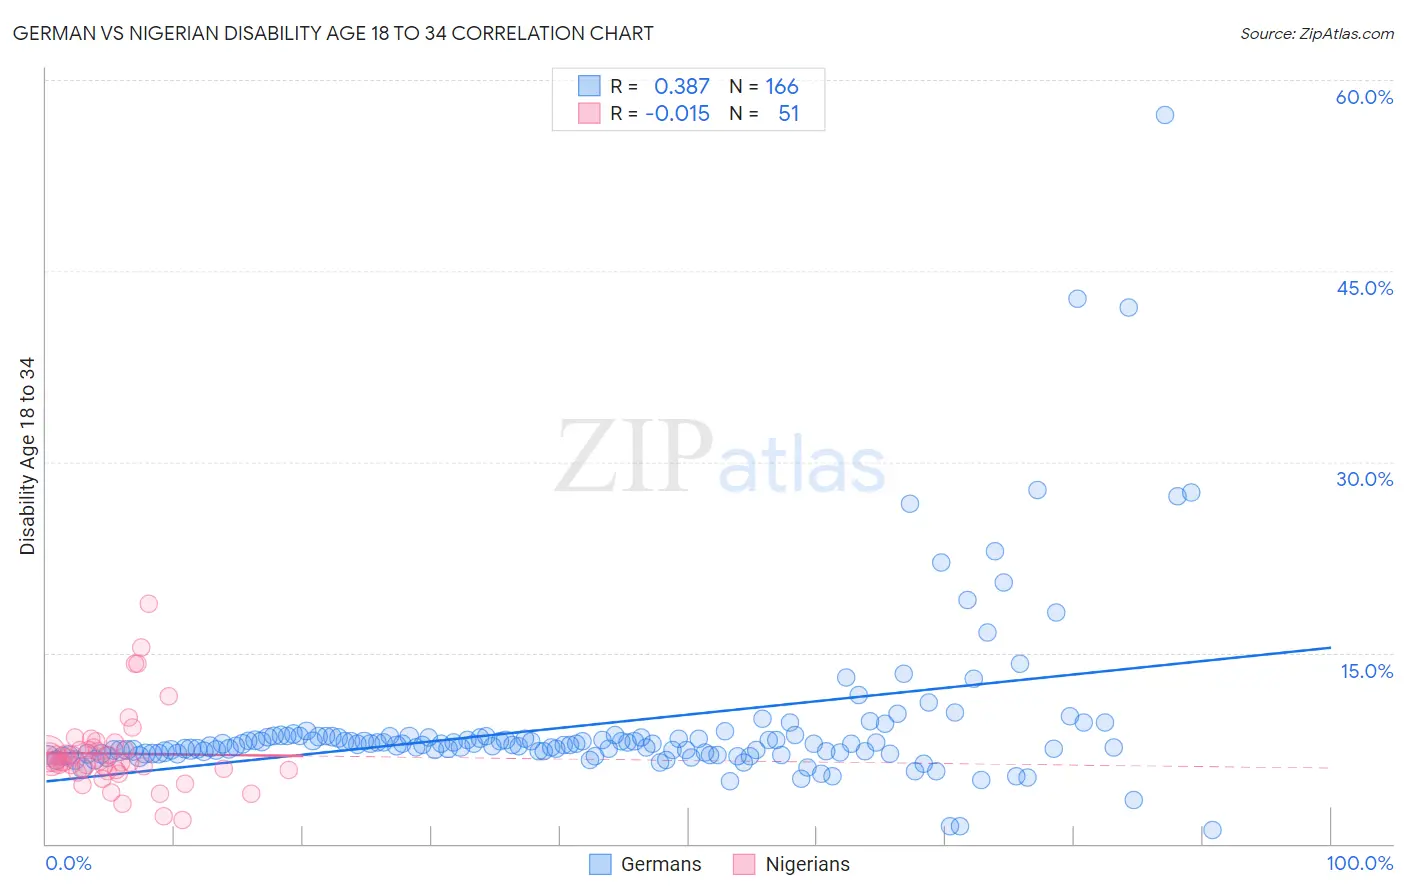
German vs Nigerian Disability Age 18 to 34 Correlation Chart
The statistical analysis conducted on geographies consisting of 573,263,682 people shows a mild positive correlation between the proportion of Germans and percentage of population with a disability between the ages 18 and 35 in the United States with a correlation coefficient (R) of 0.387 and weighted average of 7.7%. Similarly, the statistical analysis conducted on geographies consisting of 332,463,027 people shows no correlation between the proportion of Nigerians and percentage of population with a disability between the ages 18 and 35 in the United States with a correlation coefficient (R) of -0.015 and weighted average of 6.6%, a difference of 16.6%.
Disability Age 18 to 34 Correlation Summary
| Measurement | German | Nigerian |
| Minimum | 1.1% | 1.9% |
| Maximum | 57.2% | 18.8% |
| Range | 56.1% | 17.0% |
| Mean | 9.3% | 7.1% |
| Median | 7.8% | 6.4% |
| Interquartile 25% (IQ1) | 7.1% | 5.8% |
| Interquartile 75% (IQ3) | 8.4% | 7.4% |
| Interquartile Range (IQR) | 1.3% | 1.7% |
| Standard Deviation (Sample) | 6.7% | 3.1% |
| Standard Deviation (Population) | 6.7% | 3.1% |
Similar Demographics by Disability Age 18 to 34
Demographics Similar to Germans by Disability Age 18 to 34
In terms of disability age 18 to 34, the demographic groups most similar to Germans are Scottish (7.7%, a difference of 0.010%), Pima (7.7%, a difference of 0.080%), Welsh (7.7%, a difference of 0.15%), Cheyenne (7.7%, a difference of 0.21%), and Dutch (7.7%, a difference of 0.24%).
| Demographics | Rating | Rank | Disability Age 18 to 34 |
| Blacks/African Americans | 0.0 /100 | #292 | Tragic 7.7% |
| Scandinavians | 0.0 /100 | #293 | Tragic 7.7% |
| Immigrants | Cabo Verde | 0.0 /100 | #294 | Tragic 7.7% |
| Tlingit-Haida | 0.0 /100 | #295 | Tragic 7.7% |
| Cape Verdeans | 0.0 /100 | #296 | Tragic 7.7% |
| Pueblo | 0.0 /100 | #297 | Tragic 7.7% |
| Dutch | 0.0 /100 | #298 | Tragic 7.7% |
| Germans | 0.0 /100 | #299 | Tragic 7.7% |
| Scottish | 0.0 /100 | #300 | Tragic 7.7% |
| Pima | 0.0 /100 | #301 | Tragic 7.7% |
| Welsh | 0.0 /100 | #302 | Tragic 7.7% |
| Cheyenne | 0.0 /100 | #303 | Tragic 7.7% |
| Shoshone | 0.0 /100 | #304 | Tragic 7.8% |
| Menominee | 0.0 /100 | #305 | Tragic 7.8% |
| English | 0.0 /100 | #306 | Tragic 7.8% |
Demographics Similar to Nigerians by Disability Age 18 to 34
In terms of disability age 18 to 34, the demographic groups most similar to Nigerians are Syrian (6.6%, a difference of 0.040%), Immigrants from Ghana (6.6%, a difference of 0.11%), Immigrants from Africa (6.6%, a difference of 0.15%), Immigrants from Cambodia (6.6%, a difference of 0.19%), and Immigrants from Austria (6.6%, a difference of 0.29%).
| Demographics | Rating | Rank | Disability Age 18 to 34 |
| Bahamians | 55.5 /100 | #171 | Average 6.6% |
| Ghanaians | 54.7 /100 | #172 | Average 6.6% |
| Immigrants | Mexico | 54.1 /100 | #173 | Average 6.6% |
| Native Hawaiians | 50.0 /100 | #174 | Average 6.6% |
| Immigrants | Cambodia | 46.5 /100 | #175 | Average 6.6% |
| Immigrants | Africa | 45.9 /100 | #176 | Average 6.6% |
| Syrians | 44.3 /100 | #177 | Average 6.6% |
| Nigerians | 43.7 /100 | #178 | Average 6.6% |
| Immigrants | Ghana | 42.1 /100 | #179 | Average 6.6% |
| Immigrants | Austria | 39.6 /100 | #180 | Fair 6.6% |
| Romanians | 39.5 /100 | #181 | Fair 6.6% |
| U.S. Virgin Islanders | 38.6 /100 | #182 | Fair 6.7% |
| Immigrants | Iraq | 37.4 /100 | #183 | Fair 6.7% |
| Iraqis | 37.4 /100 | #184 | Fair 6.7% |
| Immigrants | Oceania | 35.4 /100 | #185 | Fair 6.7% |