Dutch vs Icelander Female Disability

COMPARE

Dutch
Race
Ancestry
AfghanAfricanAlaska NativeAlaskan AthabascanAlbanianAleutAlsatianAmericanApacheArabArapahoArgentineanArmenianAssyrian/Chaldean/SyriacAustralianAustrianBahamianBangladeshiBarbadianBasqueBelgianBelizeanBermudanBhutaneseBlackfeetBolivianBrazilianBritishBritish West IndianBulgarianBurmeseCajunCambodianCanadianCape VerdeanCarpatho RusynCelticCentral AmericanCentral American IndianCherokeeCheyenneChickasawChileanChineseChippewaChoctawColombianColvilleComancheCosta RicanCreeCreekCroatianCrowCubanCypriotCzechCzechoslovakianDanishDelawareDominicanDutchDutch West IndianEastern EuropeanEcuadorianEgyptianEnglishEstonianEthiopianEuropeanFijianFilipinoFinnishFrenchFrench American IndianFrench CanadianGermanGerman RussianGhanaianGreekGuamanian/ChamorroGuatemalanGuyaneseHaitianHmongHonduranHopiHoumaHungarianIndian (Asian)IndonesianInupiatIranianIraqiIrishIroquoisIsraeliItalianJamaicanJapaneseJordanianKenyanKiowaKoreanLaotianLatvianLebaneseLiberianLithuanianLumbeeLuxembourgerMacedonianMalaysianMalteseMarshalleseMenomineeMexicanMexican American IndianMongolianMoroccanNative HawaiianNavajoNepaleseNew ZealanderNicaraguanNigerianNorthern EuropeanNorwegianOkinawanOsageOttawaPaiutePakistaniPalestinianPanamanianParaguayanPennsylvania GermanPeruvianPimaPolishPortuguesePotawatomiPuebloPuerto RicanPuget Sound SalishRomanianRussianSalvadoranSamoanScandinavianScotch-IrishScottishSeminoleSenegaleseSerbianShoshoneSierra LeoneanSiouxSlavicSlovakSloveneSomaliSouth AfricanSouth AmericanSouth American IndianSoviet UnionSpaniardSpanishSpanish AmericanSpanish American IndianSri LankanSubsaharan AfricanSudaneseSwedishSwissSyrianTaiwaneseThaiTlingit-HaidaTohono O'OdhamTonganTrinidadian and TobagonianTsimshianTurkishU.S. Virgin IslanderUgandanUkrainianUruguayanUteVenezuelanVietnameseWelshWest IndianYakamaYaquiYugoslavianYumanYup'ikZimbabwean
Immigration
NonimmigrantsImmigrantsAfghanistanAfricaAlbaniaArgentinaArmeniaAsiaAustraliaAustriaBahamasBangladeshBarbadosBelarusBelgiumBelizeBoliviaBosnia and HerzegovinaBrazilBulgariaBurma/MyanmarCabo VerdeCambodiaCameroonCanadaCaribbeanCentral AmericaChileChinaColombiaCongoCosta RicaCroatiaCubaCzechoslovakiaDenmarkDominicaDominican RepublicEastern AfricaEastern AsiaEastern EuropeEcuadorEgyptEl SalvadorEnglandEritreaEthiopiaEuropeFijiFranceGermanyGhanaGreeceGrenadaGuatemalaGuyanaHaitiHondurasHong KongHungaryIndiaIndonesiaIranIraqIrelandIsraelItalyJamaicaJapanJordanKazakhstanKenyaKoreaKuwaitLaosLatin AmericaLatviaLebanonLiberiaLithuaniaMalaysiaMexicoMicronesiaMiddle AfricaMoldovaMoroccoNepalNetherlandsNicaraguaNigeriaNorth AmericaNorth MacedoniaNorthern AfricaNorthern EuropeNorwayOceaniaPakistanPanamaPeruPhilippinesPolandPortugalRomaniaRussiaSaudi ArabiaScotlandSenegalSerbiaSierra LeoneSingaporeSomaliaSouth AfricaSouth AmericaSouth Central AsiaSouth Eastern AsiaSouthern EuropeSpainSri LankaSt. Vincent and the GrenadinesSudanSwedenSwitzerlandSyriaTaiwanThailandTrinidad and TobagoTurkeyUgandaUkraineUruguayUzbekistanVenezuelaVietnamWest IndiesWestern AfricaWestern AsiaWestern EuropeYemenZaireZimbabweAzores
Icelander
Race
Ancestry
AfghanAfricanAlaska NativeAlaskan AthabascanAlbanianAleutAlsatianAmericanApacheArabArapahoArgentineanArmenianAssyrian/Chaldean/SyriacAustralianAustrianBahamianBangladeshiBarbadianBasqueBelgianBelizeanBermudanBhutaneseBlackfeetBolivianBrazilianBritishBritish West IndianBulgarianBurmeseCajunCambodianCanadianCape VerdeanCarpatho RusynCelticCentral AmericanCentral American IndianCherokeeCheyenneChickasawChileanChineseChippewaChoctawColombianColvilleComancheCosta RicanCreeCreekCroatianCrowCubanCypriotCzechCzechoslovakianDanishDelawareDominicanDutch West IndianEastern EuropeanEcuadorianEgyptianEnglishEstonianEthiopianEuropeanFijianFilipinoFinnishFrenchFrench American IndianFrench CanadianGermanGerman RussianGhanaianGreekGuamanian/ChamorroGuatemalanGuyaneseHaitianHmongHonduranHopiHoumaHungarianIcelanderIndian (Asian)IndonesianInupiatIranianIraqiIrishIroquoisIsraeliItalianJamaicanJapaneseJordanianKenyanKiowaKoreanLaotianLatvianLebaneseLiberianLithuanianLumbeeLuxembourgerMacedonianMalaysianMalteseMarshalleseMenomineeMexicanMexican American IndianMongolianMoroccanNative HawaiianNavajoNepaleseNew ZealanderNicaraguanNigerianNorthern EuropeanNorwegianOkinawanOsageOttawaPaiutePakistaniPalestinianPanamanianParaguayanPennsylvania GermanPeruvianPimaPolishPortuguesePotawatomiPuebloPuerto RicanPuget Sound SalishRomanianRussianSalvadoranSamoanScandinavianScotch-IrishScottishSeminoleSenegaleseSerbianShoshoneSierra LeoneanSiouxSlavicSlovakSloveneSomaliSouth AfricanSouth AmericanSouth American IndianSoviet UnionSpaniardSpanishSpanish AmericanSpanish American IndianSri LankanSubsaharan AfricanSudaneseSwedishSwissSyrianTaiwaneseThaiTlingit-HaidaTohono O'OdhamTonganTrinidadian and TobagonianTsimshianTurkishU.S. Virgin IslanderUgandanUkrainianUruguayanUteVenezuelanVietnameseWelshWest IndianYakamaYaquiYugoslavianYumanYup'ikZimbabwean
Immigration
NonimmigrantsImmigrantsAfghanistanAfricaAlbaniaArgentinaArmeniaAsiaAustraliaAustriaBahamasBangladeshBarbadosBelarusBelgiumBelizeBoliviaBosnia and HerzegovinaBrazilBulgariaBurma/MyanmarCabo VerdeCambodiaCameroonCanadaCaribbeanCentral AmericaChileChinaColombiaCongoCosta RicaCroatiaCubaCzechoslovakiaDenmarkDominicaDominican RepublicEastern AfricaEastern AsiaEastern EuropeEcuadorEgyptEl SalvadorEnglandEritreaEthiopiaEuropeFijiFranceGermanyGhanaGreeceGrenadaGuatemalaGuyanaHaitiHondurasHong KongHungaryIndiaIndonesiaIranIraqIrelandIsraelItalyJamaicaJapanJordanKazakhstanKenyaKoreaKuwaitLaosLatin AmericaLatviaLebanonLiberiaLithuaniaMalaysiaMexicoMicronesiaMiddle AfricaMoldovaMoroccoNepalNetherlandsNicaraguaNigeriaNorth AmericaNorth MacedoniaNorthern AfricaNorthern EuropeNorwayOceaniaPakistanPanamaPeruPhilippinesPolandPortugalRomaniaRussiaSaudi ArabiaScotlandSenegalSerbiaSierra LeoneSingaporeSomaliaSouth AfricaSouth AmericaSouth Central AsiaSouth Eastern AsiaSouthern EuropeSpainSri LankaSt. Vincent and the GrenadinesSudanSwedenSwitzerlandSyriaTaiwanThailandTrinidad and TobagoTurkeyUgandaUkraineUruguayUzbekistanVenezuelaVietnamWest IndiesWestern AfricaWestern AsiaWestern EuropeYemenZaireZimbabweAzores
Female Disability
Income
Poverty
Unemployment
Labor Participation
Family Structure
Vehicle Availability
Education Level
Disability

Female Disability Comparison

Dutch

Icelanders

Tragic
Excellent
12.9%
FEMALE DISABILITY
0.2/ 100
METRIC RATING
271st/ 347
METRIC RANK
12.0%
FEMALE DISABILITY
80.7/ 100
METRIC RATING
151st/ 347
METRIC RANK

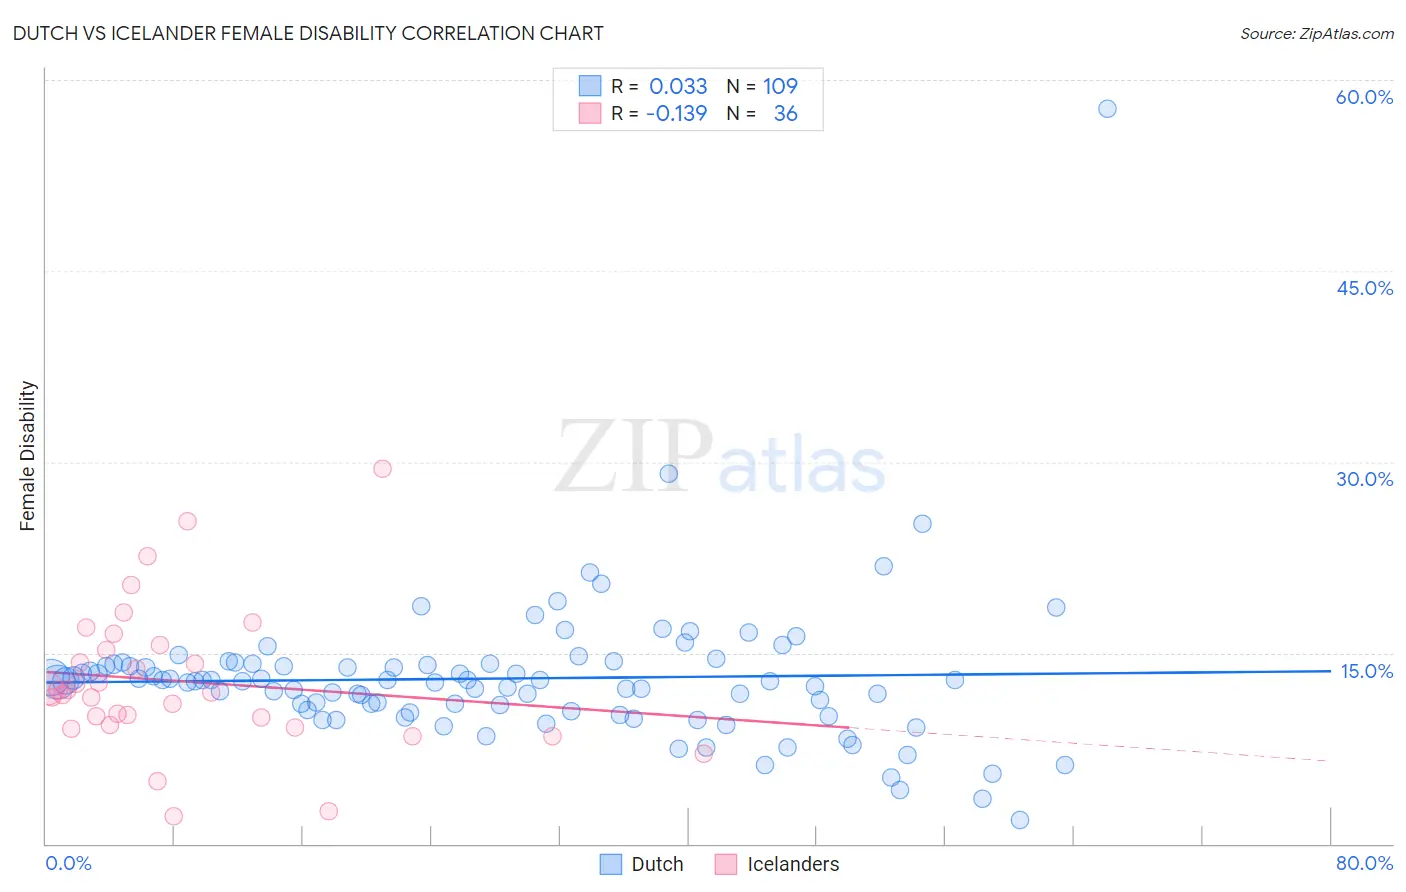
Dutch vs Icelander Female Disability Correlation Chart

The statistical analysis conducted on geographies consisting of 554,147,365 people shows no correlation between the proportion of Dutch and percentage of females with a disability in the United States with a correlation coefficient (R) of 0.033 and weighted average of 12.9%. Similarly, the statistical analysis conducted on geographies consisting of 159,642,732 people shows a poor negative correlation between the proportion of Icelanders and percentage of females with a disability in the United States with a correlation coefficient (R) of -0.139 and weighted average of 12.0%, a difference of 7.4%.
Dutch vs Icelander Female Disability

Female Disability Correlation Summary

MeasurementDutchIcelander
Minimum1.9%2.2%
Maximum57.7%29.5%
Range55.9%27.3%
Mean13.0%12.8%
Median12.8%12.0%
Interquartile 25% (IQ1)10.5%9.6%
Interquartile 75% (IQ3)14.1%15.4%
Interquartile Range (IQR)3.7%5.8%
Standard Deviation (Sample)5.9%5.7%
Standard Deviation (Population)5.9%5.6%

Similar Demographics by Female Disability

Demographics Similar to Dutch by Female Disability

In terms of female disability, the demographic groups most similar to Dutch are German (12.9%, a difference of 0.21%), Sioux (12.9%, a difference of 0.23%), Portuguese (13.0%, a difference of 0.35%), Cheyenne (13.0%, a difference of 0.40%), and Immigrants from Dominica (13.0%, a difference of 0.45%).
DemographicsRating | RankFemale Disability
Alaska Natives
0.6
/100
|
#264
Tragic
12.8%
West Indians
0.5
/100
|
#265
Tragic
12.8%
Finns
0.4
/100
|
#266
Tragic
12.8%
Senegalese
0.4
/100
|
#267
Tragic
12.8%
Immigrants | Laos
0.4
/100
|
#268
Tragic
12.8%
Indonesians
0.4
/100
|
#269
Tragic
12.8%
Immigrants | Liberia
0.3
/100
|
#270
Tragic
12.9%
Dutch
0.2
/100
|
#271
Tragic
12.9%
Germans
0.1
/100
|
#272
Tragic
12.9%
Sioux
0.1
/100
|
#273
Tragic
12.9%
Portuguese
0.1
/100
|
#274
Tragic
13.0%
Cheyenne
0.1
/100
|
#275
Tragic
13.0%
Immigrants | Dominica
0.1
/100
|
#276
Tragic
13.0%
Spanish
0.1
/100
|
#277
Tragic
13.0%
Scottish
0.1
/100
|
#278
Tragic
13.0%

Demographics Similar to Icelanders by Female Disability

In terms of female disability, the demographic groups most similar to Icelanders are Immigrants from Moldova (12.0%, a difference of 0.040%), Greek (12.0%, a difference of 0.080%), Immigrants from Scotland (12.0%, a difference of 0.090%), Sudanese (12.0%, a difference of 0.090%), and Immigrants from Kenya (12.0%, a difference of 0.15%).
DemographicsRating | RankFemale Disability
Immigrants | Austria
87.9
/100
|
#144
Excellent
12.0%
Estonians
87.8
/100
|
#145
Excellent
12.0%
Pakistanis
84.6
/100
|
#146
Excellent
12.0%
Nigerians
84.0
/100
|
#147
Excellent
12.0%
Immigrants | Kenya
83.1
/100
|
#148
Excellent
12.0%
Greeks
82.0
/100
|
#149
Excellent
12.0%
Immigrants | Moldova
81.4
/100
|
#150
Excellent
12.0%
Icelanders
80.7
/100
|
#151
Excellent
12.0%
Immigrants | Scotland
79.3
/100
|
#152
Good
12.0%
Sudanese
79.1
/100
|
#153
Good
12.0%
Syrians
76.9
/100
|
#154
Good
12.1%
Ghanaians
76.6
/100
|
#155
Good
12.1%
Moroccans
72.9
/100
|
#156
Good
12.1%
Danes
72.5
/100
|
#157
Good
12.1%
Immigrants | Middle Africa
72.4
/100
|
#158
Good
12.1%