Chinese vs Immigrants from Dominica Male Disability
COMPARE
Chinese
Immigrants from Dominica
Male Disability
Male Disability Comparison
Chinese
Immigrants from Dominica
12.1%
MALE DISABILITY
0.4/ 100
METRIC RATING
255th/ 347
METRIC RANK
11.7%
MALE DISABILITY
4.6/ 100
METRIC RATING
217th/ 347
METRIC RANK
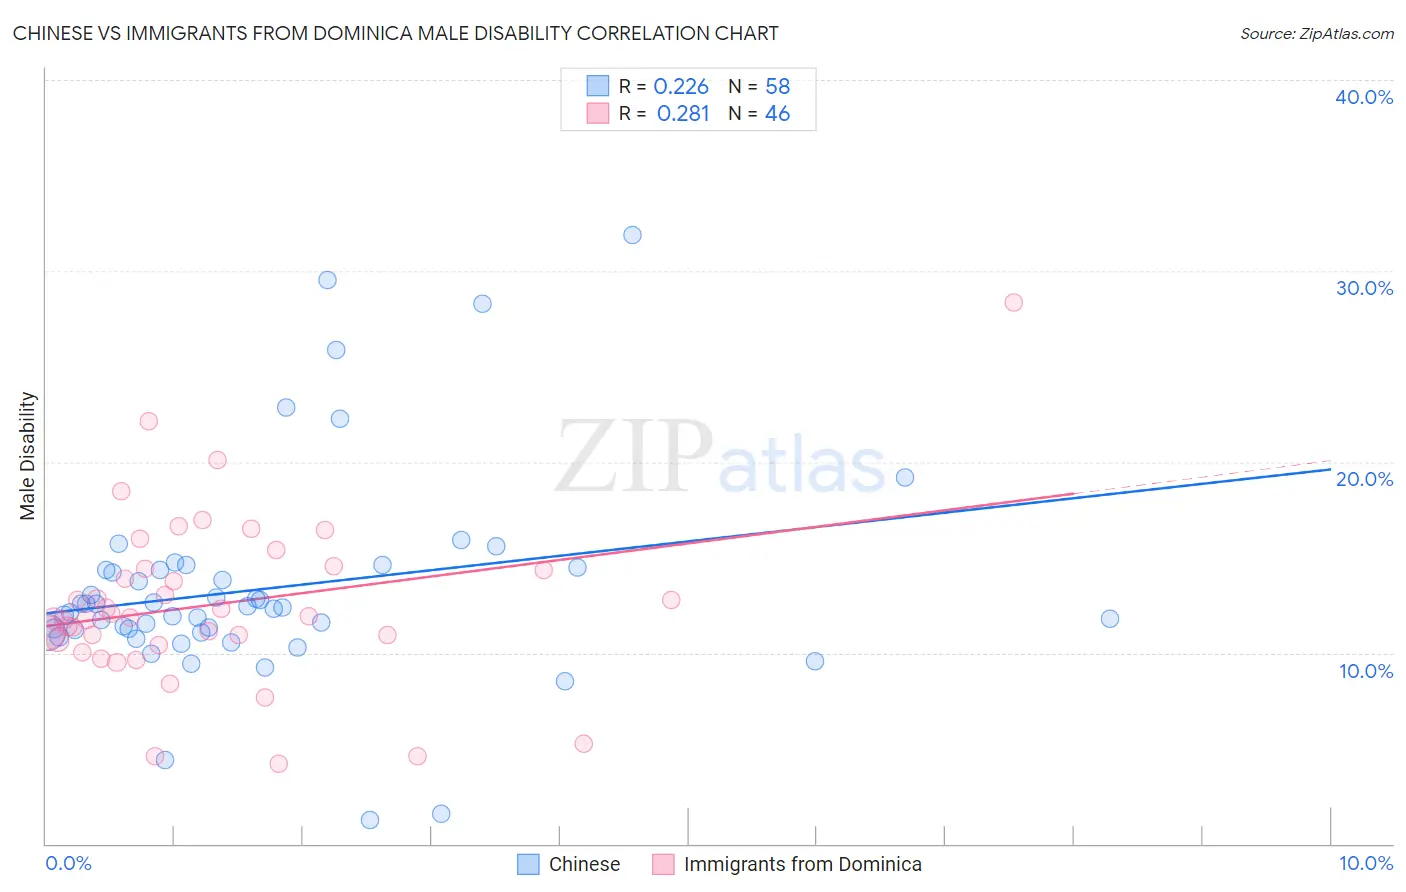
Chinese vs Immigrants from Dominica Male Disability Correlation Chart
The statistical analysis conducted on geographies consisting of 64,802,721 people shows a weak positive correlation between the proportion of Chinese and percentage of males with a disability in the United States with a correlation coefficient (R) of 0.226 and weighted average of 12.1%. Similarly, the statistical analysis conducted on geographies consisting of 83,789,752 people shows a weak positive correlation between the proportion of Immigrants from Dominica and percentage of males with a disability in the United States with a correlation coefficient (R) of 0.281 and weighted average of 11.7%, a difference of 3.2%.
Male Disability Correlation Summary
| Measurement | Chinese | Immigrants from Dominica |
| Minimum | 1.3% | 4.2% |
| Maximum | 31.9% | 28.4% |
| Range | 30.7% | 24.2% |
| Mean | 13.4% | 12.5% |
| Median | 12.4% | 11.9% |
| Interquartile 25% (IQ1) | 11.1% | 10.6% |
| Interquartile 75% (IQ3) | 14.4% | 14.4% |
| Interquartile Range (IQR) | 3.3% | 3.8% |
| Standard Deviation (Sample) | 5.6% | 4.4% |
| Standard Deviation (Population) | 5.5% | 4.4% |
Similar Demographics by Male Disability
Demographics Similar to Chinese by Male Disability
In terms of male disability, the demographic groups most similar to Chinese are British (12.1%, a difference of 0.010%), Slovene (12.0%, a difference of 0.20%), Guamanian/Chamorro (12.0%, a difference of 0.20%), Swiss (12.1%, a difference of 0.25%), and European (12.1%, a difference of 0.25%).
| Demographics | Rating | Rank | Male Disability |
| Poles | 0.7 /100 | #248 | Tragic 12.0% |
| Immigrants | Yemen | 0.5 /100 | #249 | Tragic 12.0% |
| Bangladeshis | 0.5 /100 | #250 | Tragic 12.0% |
| German Russians | 0.5 /100 | #251 | Tragic 12.0% |
| Slovenes | 0.5 /100 | #252 | Tragic 12.0% |
| Guamanians/Chamorros | 0.5 /100 | #253 | Tragic 12.0% |
| British | 0.4 /100 | #254 | Tragic 12.1% |
| Chinese | 0.4 /100 | #255 | Tragic 12.1% |
| Swiss | 0.3 /100 | #256 | Tragic 12.1% |
| Europeans | 0.3 /100 | #257 | Tragic 12.1% |
| Basques | 0.3 /100 | #258 | Tragic 12.1% |
| Belgians | 0.3 /100 | #259 | Tragic 12.1% |
| Swedes | 0.3 /100 | #260 | Tragic 12.1% |
| Slavs | 0.2 /100 | #261 | Tragic 12.2% |
| Norwegians | 0.2 /100 | #262 | Tragic 12.2% |
Demographics Similar to Immigrants from Dominica by Male Disability
In terms of male disability, the demographic groups most similar to Immigrants from Dominica are Immigrants from Dominican Republic (11.7%, a difference of 0.070%), Immigrants from England (11.7%, a difference of 0.21%), Panamanian (11.7%, a difference of 0.27%), Immigrants from Western Europe (11.7%, a difference of 0.28%), and Immigrants from Congo (11.7%, a difference of 0.29%).
| Demographics | Rating | Rank | Male Disability |
| Ute | 9.4 /100 | #210 | Tragic 11.6% |
| Immigrants | Thailand | 8.4 /100 | #211 | Tragic 11.6% |
| Immigrants | Scotland | 8.2 /100 | #212 | Tragic 11.6% |
| Mexican American Indians | 7.8 /100 | #213 | Tragic 11.6% |
| Lithuanians | 6.6 /100 | #214 | Tragic 11.6% |
| Indonesians | 5.9 /100 | #215 | Tragic 11.6% |
| Immigrants | Dominican Republic | 4.9 /100 | #216 | Tragic 11.7% |
| Immigrants | Dominica | 4.6 /100 | #217 | Tragic 11.7% |
| Immigrants | England | 4.0 /100 | #218 | Tragic 11.7% |
| Panamanians | 3.8 /100 | #219 | Tragic 11.7% |
| Immigrants | Western Europe | 3.8 /100 | #220 | Tragic 11.7% |
| Immigrants | Congo | 3.7 /100 | #221 | Tragic 11.7% |
| Alsatians | 3.3 /100 | #222 | Tragic 11.7% |
| Immigrants | Bahamas | 3.2 /100 | #223 | Tragic 11.7% |
| Japanese | 3.1 /100 | #224 | Tragic 11.7% |