Basque vs Paiute Disability Age Under 5
COMPARE
Basque
Paiute
Disability Age Under 5
Disability Age Under 5 Comparison
Basques
Paiute
1.3%
DISABILITY AGE UNDER 5
3.0/ 100
METRIC RATING
237th/ 347
METRIC RANK
3.9%
DISABILITY AGE UNDER 5
0.0/ 100
METRIC RATING
345th/ 347
METRIC RANK
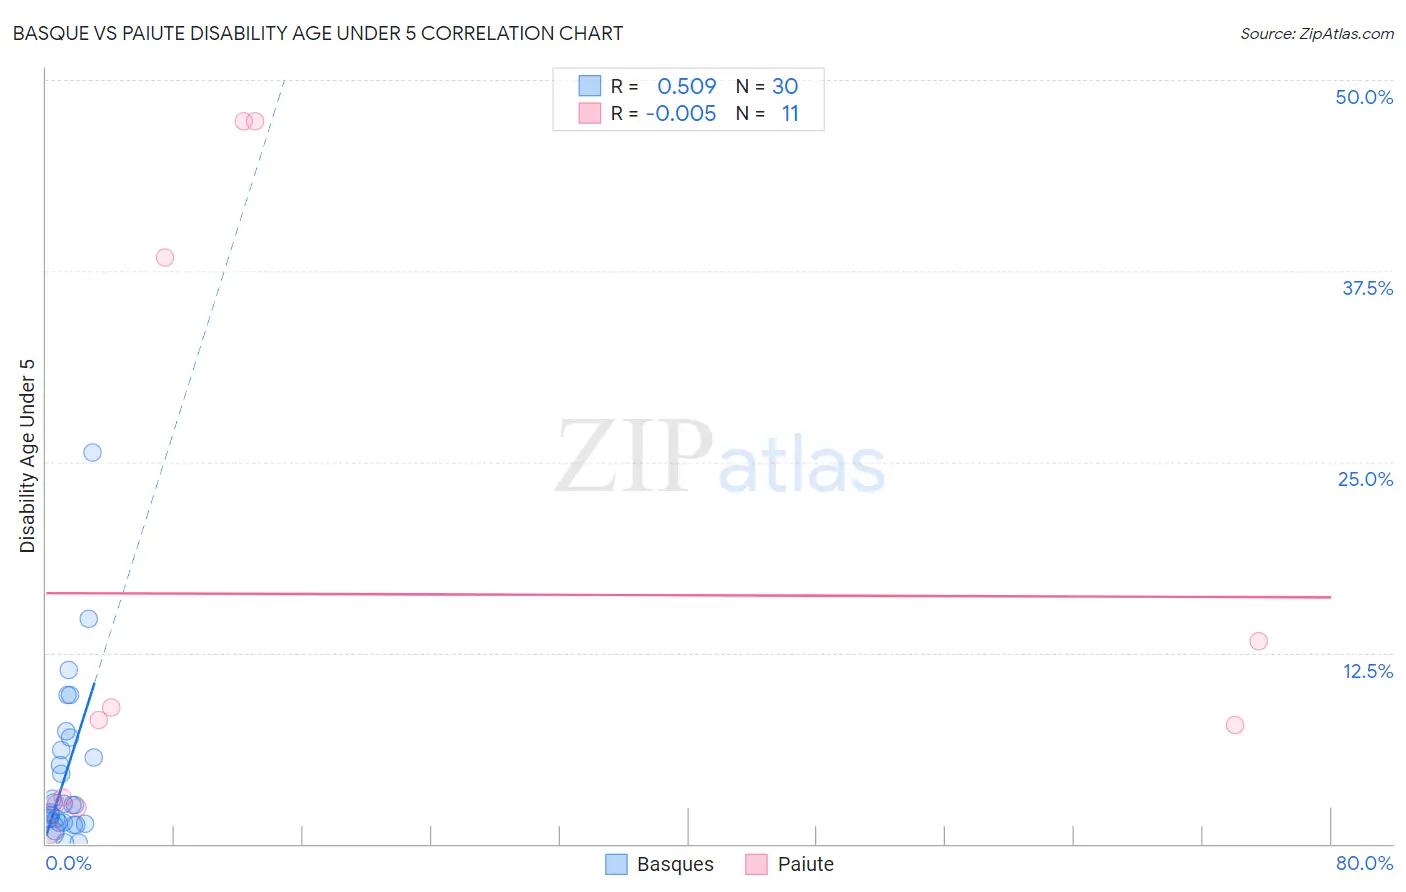
Basque vs Paiute Disability Age Under 5 Correlation Chart
The statistical analysis conducted on geographies consisting of 115,640,652 people shows a substantial positive correlation between the proportion of Basques and percentage of population with a disability under the age of 5 in the United States with a correlation coefficient (R) of 0.509 and weighted average of 1.3%. Similarly, the statistical analysis conducted on geographies consisting of 49,758,622 people shows no correlation between the proportion of Paiute and percentage of population with a disability under the age of 5 in the United States with a correlation coefficient (R) of -0.005 and weighted average of 3.9%, a difference of 192.2%.
Disability Age Under 5 Correlation Summary
| Measurement | Basque | Paiute |
| Minimum | 0.11% | 0.83% |
| Maximum | 25.6% | 47.3% |
| Range | 25.5% | 46.5% |
| Mean | 4.6% | 16.3% |
| Median | 2.5% | 8.1% |
| Interquartile 25% (IQ1) | 1.4% | 2.6% |
| Interquartile 75% (IQ3) | 6.1% | 38.4% |
| Interquartile Range (IQR) | 4.7% | 35.7% |
| Standard Deviation (Sample) | 5.4% | 18.5% |
| Standard Deviation (Population) | 5.3% | 17.6% |
Similar Demographics by Disability Age Under 5
Demographics Similar to Basques by Disability Age Under 5
In terms of disability age under 5, the demographic groups most similar to Basques are South American Indian (1.3%, a difference of 0.24%), Spanish American Indian (1.3%, a difference of 0.43%), Central American Indian (1.3%, a difference of 0.44%), Pueblo (1.3%, a difference of 0.51%), and Immigrants from Austria (1.3%, a difference of 0.59%).
| Demographics | Rating | Rank | Disability Age Under 5 |
| Lebanese | 5.3 /100 | #230 | Tragic 1.3% |
| Immigrants | Northern Europe | 4.7 /100 | #231 | Tragic 1.3% |
| French American Indians | 4.5 /100 | #232 | Tragic 1.3% |
| Tongans | 4.2 /100 | #233 | Tragic 1.3% |
| Pueblo | 3.8 /100 | #234 | Tragic 1.3% |
| Central American Indians | 3.6 /100 | #235 | Tragic 1.3% |
| South American Indians | 3.3 /100 | #236 | Tragic 1.3% |
| Basques | 3.0 /100 | #237 | Tragic 1.3% |
| Spanish American Indians | 2.4 /100 | #238 | Tragic 1.3% |
| Immigrants | Austria | 2.3 /100 | #239 | Tragic 1.3% |
| Native Hawaiians | 2.2 /100 | #240 | Tragic 1.3% |
| Maltese | 2.2 /100 | #241 | Tragic 1.3% |
| Lumbee | 2.1 /100 | #242 | Tragic 1.3% |
| Immigrants | Cameroon | 1.7 /100 | #243 | Tragic 1.4% |
| Spaniards | 1.4 /100 | #244 | Tragic 1.4% |
Demographics Similar to Paiute by Disability Age Under 5
In terms of disability age under 5, the demographic groups most similar to Paiute are Inupiat (3.7%, a difference of 5.3%), Yup'ik (4.5%, a difference of 15.8%), Hopi (4.6%, a difference of 18.4%), Colville (3.3%, a difference of 19.0%), and Alaska Native (2.9%, a difference of 32.9%).
| Demographics | Rating | Rank | Disability Age Under 5 |
| Dutch West Indians | 0.0 /100 | #333 | Tragic 1.9% |
| Natives/Alaskans | 0.0 /100 | #334 | Tragic 1.9% |
| Pennsylvania Germans | 0.0 /100 | #335 | Tragic 1.9% |
| Paraguayans | 0.0 /100 | #336 | Tragic 2.0% |
| Apache | 0.0 /100 | #337 | Tragic 2.0% |
| Tohono O'odham | 0.0 /100 | #338 | Tragic 2.2% |
| Immigrants | Azores | 0.0 /100 | #339 | Tragic 2.2% |
| Menominee | 0.0 /100 | #340 | Tragic 2.3% |
| Tsimshian | 0.0 /100 | #341 | Tragic 2.4% |
| Alaska Natives | 0.0 /100 | #342 | Tragic 2.9% |
| Colville | 0.0 /100 | #343 | Tragic 3.3% |
| Inupiat | 0.0 /100 | #344 | Tragic 3.7% |
| Paiute | 0.0 /100 | #345 | Tragic 3.9% |
| Yup'ik | 0.0 /100 | #346 | Tragic 4.5% |
| Hopi | 0.0 /100 | #347 | Tragic 4.6% |