Australian vs Immigrants from Middle Africa Male Disability
COMPARE
Australian
Immigrants from Middle Africa
Male Disability
Male Disability Comparison
Australians
Immigrants from Middle Africa
11.3%
MALE DISABILITY
42.2/ 100
METRIC RATING
178th/ 347
METRIC RANK
11.1%
MALE DISABILITY
70.9/ 100
METRIC RATING
155th/ 347
METRIC RANK
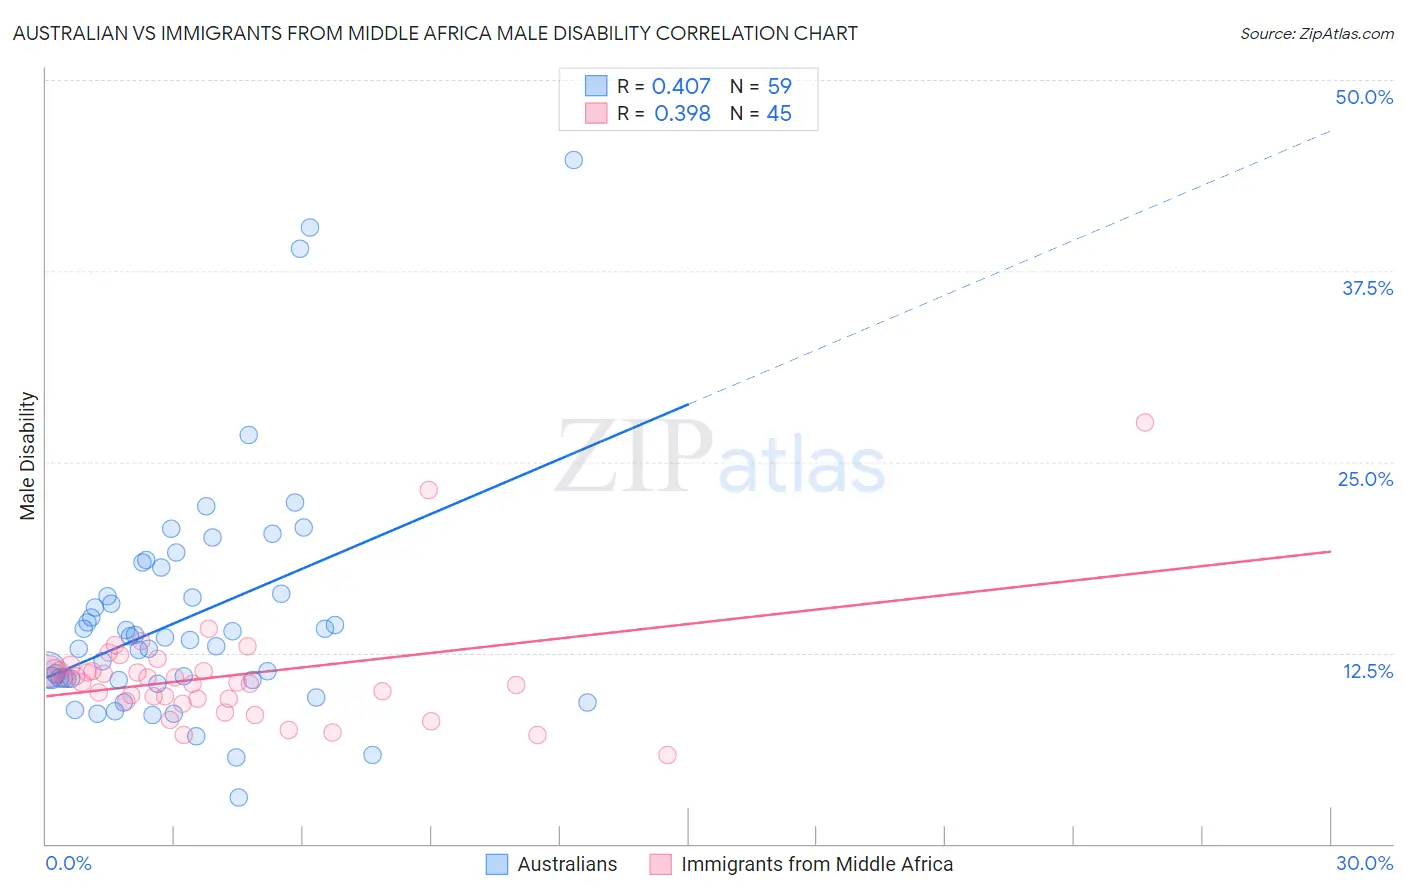
Australian vs Immigrants from Middle Africa Male Disability Correlation Chart
The statistical analysis conducted on geographies consisting of 224,140,588 people shows a moderate positive correlation between the proportion of Australians and percentage of males with a disability in the United States with a correlation coefficient (R) of 0.407 and weighted average of 11.3%. Similarly, the statistical analysis conducted on geographies consisting of 202,727,084 people shows a mild positive correlation between the proportion of Immigrants from Middle Africa and percentage of males with a disability in the United States with a correlation coefficient (R) of 0.398 and weighted average of 11.1%, a difference of 1.7%.
Male Disability Correlation Summary
| Measurement | Australian | Immigrants from Middle Africa |
| Minimum | 3.0% | 5.8% |
| Maximum | 44.7% | 27.6% |
| Range | 41.7% | 21.8% |
| Mean | 14.8% | 11.0% |
| Median | 13.3% | 10.5% |
| Interquartile 25% (IQ1) | 10.8% | 9.4% |
| Interquartile 75% (IQ3) | 16.4% | 11.3% |
| Interquartile Range (IQR) | 5.6% | 1.9% |
| Standard Deviation (Sample) | 7.7% | 3.6% |
| Standard Deviation (Population) | 7.6% | 3.6% |
Similar Demographics by Male Disability
Demographics Similar to Australians by Male Disability
In terms of male disability, the demographic groups most similar to Australians are Immigrants from Caribbean (11.3%, a difference of 0.040%), Honduran (11.3%, a difference of 0.060%), Immigrants from Norway (11.3%, a difference of 0.11%), Syrian (11.2%, a difference of 0.24%), and Immigrants from Honduras (11.2%, a difference of 0.36%).
| Demographics | Rating | Rank | Male Disability |
| Haitians | 52.5 /100 | #171 | Average 11.2% |
| Romanians | 50.7 /100 | #172 | Average 11.2% |
| Immigrants | Burma/Myanmar | 50.4 /100 | #173 | Average 11.2% |
| Maltese | 50.0 /100 | #174 | Average 11.2% |
| Immigrants | Honduras | 48.7 /100 | #175 | Average 11.2% |
| Syrians | 46.6 /100 | #176 | Average 11.2% |
| Immigrants | Norway | 44.2 /100 | #177 | Average 11.3% |
| Australians | 42.2 /100 | #178 | Average 11.3% |
| Immigrants | Caribbean | 41.4 /100 | #179 | Average 11.3% |
| Hondurans | 41.1 /100 | #180 | Average 11.3% |
| Immigrants | Senegal | 34.4 /100 | #181 | Fair 11.3% |
| Immigrants | Belize | 33.7 /100 | #182 | Fair 11.3% |
| Immigrants | Central America | 32.9 /100 | #183 | Fair 11.3% |
| Iraqis | 30.5 /100 | #184 | Fair 11.3% |
| Pakistanis | 30.3 /100 | #185 | Fair 11.3% |
Demographics Similar to Immigrants from Middle Africa by Male Disability
In terms of male disability, the demographic groups most similar to Immigrants from Middle Africa are Russian (11.1%, a difference of 0.070%), Immigrants from Western Africa (11.1%, a difference of 0.11%), Immigrants from Moldova (11.1%, a difference of 0.14%), Immigrants from Northern Europe (11.1%, a difference of 0.16%), and Latvian (11.1%, a difference of 0.18%).
| Demographics | Rating | Rank | Male Disability |
| Sudanese | 77.1 /100 | #148 | Good 11.0% |
| Immigrants | Denmark | 76.4 /100 | #149 | Good 11.0% |
| Immigrants | Guatemala | 75.1 /100 | #150 | Good 11.0% |
| Cubans | 74.9 /100 | #151 | Good 11.0% |
| Immigrants | Albania | 74.4 /100 | #152 | Good 11.0% |
| Immigrants | Northern Europe | 73.2 /100 | #153 | Good 11.1% |
| Immigrants | Moldova | 72.8 /100 | #154 | Good 11.1% |
| Immigrants | Middle Africa | 70.9 /100 | #155 | Good 11.1% |
| Russians | 69.8 /100 | #156 | Good 11.1% |
| Immigrants | Western Africa | 69.2 /100 | #157 | Good 11.1% |
| Latvians | 68.1 /100 | #158 | Good 11.1% |
| Guatemalans | 67.2 /100 | #159 | Good 11.1% |
| Albanians | 66.5 /100 | #160 | Good 11.1% |
| Immigrants | West Indies | 65.7 /100 | #161 | Good 11.1% |
| Immigrants | Haiti | 65.3 /100 | #162 | Good 11.1% |