Zip Codes with the Highest Percentage of Population with a Degree in Visual and Performing Arts in Fairfield, CT
RELATED REPORTS & OPTIONS
Visual and Performing Arts
Fairfield
Compare Zip Codes
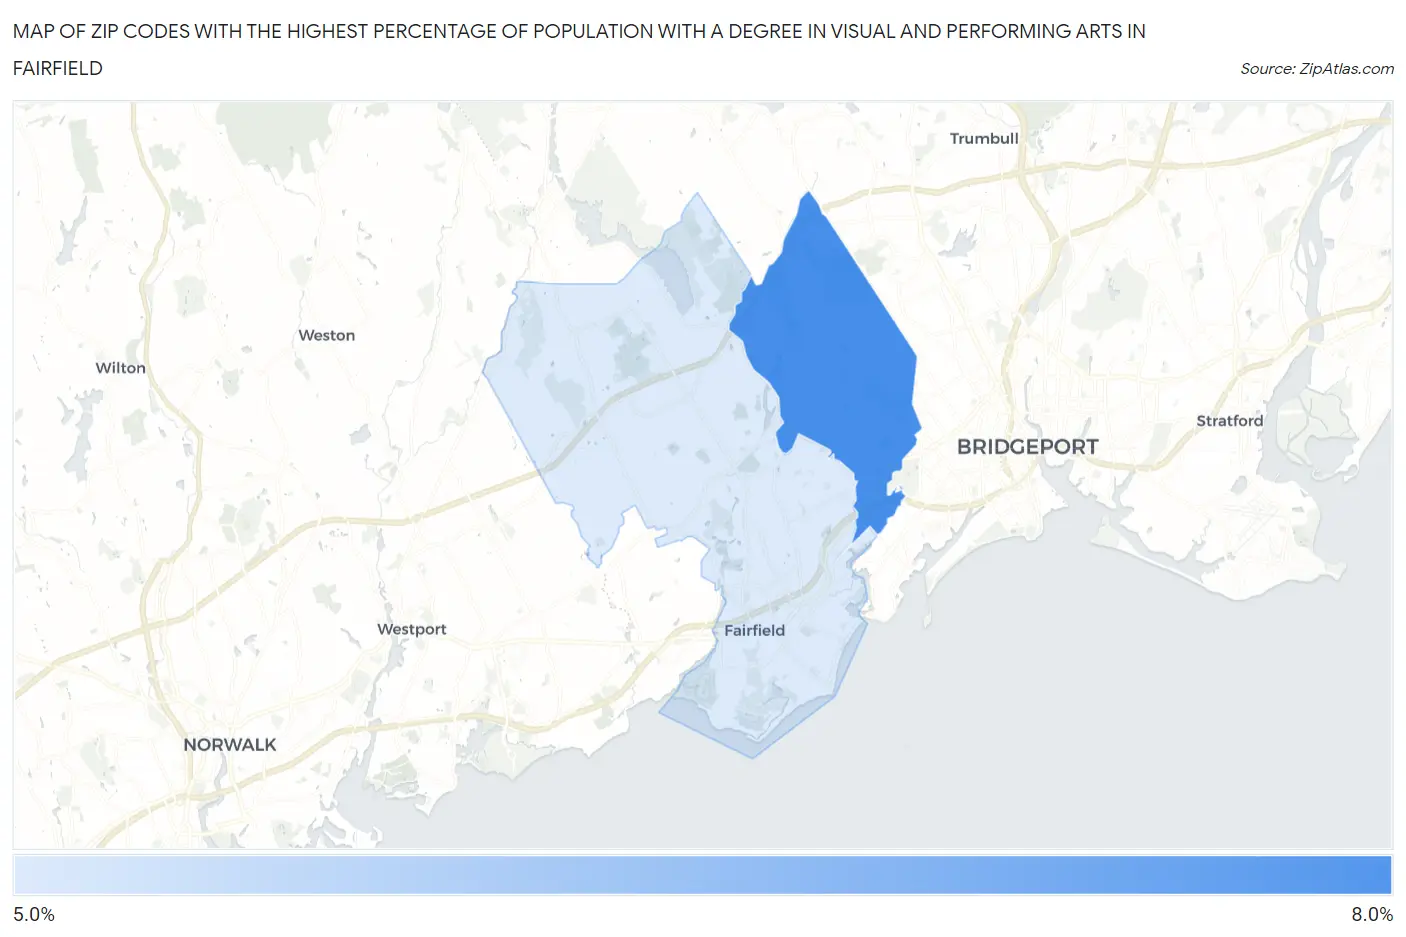
Map of Zip Codes with the Highest Percentage of Population with a Degree in Visual and Performing Arts in Fairfield
0.0%
8.0%
Zip Codes with the Highest Percentage of Population with a Degree in Visual and Performing Arts in Fairfield, CT
| Zip Code | % Graduates | vs State | vs National | |
| 1. | 06825 | 7.5% | 4.7%(+2.80)#45 | 4.3%(+3.26)#3,204 |
| 2. | 06824 | 5.4% | 4.7%(+0.652)#97 | 4.3%(+1.12)#5,914 |
1
Common Questions
What are the Top Zip Codes with the Highest Percentage of Population with a Degree in Visual and Performing Arts in Fairfield, CT?
Top Zip Codes with the Highest Percentage of Population with a Degree in Visual and Performing Arts in Fairfield, CT are:
What zip code has the Highest Percentage of Population with a Degree in Visual and Performing Arts in Fairfield, CT?
06825 has the Highest Percentage of Population with a Degree in Visual and Performing Arts in Fairfield, CT with 7.5%.
What is the Percentage of Population with a Degree in Visual and Performing Arts in Connecticut?
Percentage of Population with a Degree in Visual and Performing Arts in Connecticut is 4.7%.
What is the Percentage of Population with a Degree in Visual and Performing Arts in the United States?
Percentage of Population with a Degree in Visual and Performing Arts in the United States is 4.3%.