Zip Codes with the Highest Percentage of Population with a Degree in Literature and Languages in Colorado Springs, CO

RELATED REPORTS & OPTIONS

Literature and Languages
Population
Families and Households
Female Fertility
Female Fertility (Unmarried)
Race (Community Size)
Race (Percentage)
Ancestry (Community Size)
AfghanAfricanAlaskan AthabascanAlbanianAlsatianAmericanApacheArabArapahoArgentineanArmenianAustralianAustrianBangladeshiBarbadianBasqueBelgianBelizeanBermudanBhutaneseBlackfeetBolivianBrazilianBritishBritish West IndianBulgarianBurmeseCajunCambodianCanadianCape VerdeanCarpatho RusynCelticCentral AmericanCentral American IndianCherokeeCheyenneChickasawChileanChineseChippewaChoctawColombianComancheCosta RicanCreeCreekCroatianCubanCzechCzechoslovakianDanishDelawareDominicanDutchEastern EuropeanEcuadorianEgyptianEnglishEstonianEthiopianEuropeanFilipinoFinnishFrenchFrench CanadianGermanGerman RussianGhanaianGreekGuamanian / ChamorroGuatemalanHaitianHonduranHopiHungarianIcelanderIndian (Asian)IndonesianInupiatIranianIraqiIrishIroquoisIsraeliItalianJamaicanJapaneseJordanianKenyanKoreanLaotianLatvianLebaneseLiberianLithuanianLuxembourgerMacedonianMalaysianMexicanMexican American IndianNative HawaiianNavajoNew ZealanderNicaraguanNigerianNorthern EuropeanNorwegianOkinawanOsagePakistaniPalestinianPanamanianPennsylvania GermanPeruvianPolishPortuguesePotawatomiPuebloPuerto RicanRomanianRussianSalvadoranSamoanScandinavianScotch-IrishScottishSeminoleSerbianShoshoneSiouxSlavicSlovakSloveneSomaliSouth AfricanSouth AmericanSouth American IndianSpaniardSpanishSpanish AmericanSpanish American IndianSri LankanSubsaharan AfricanSudaneseSwedishSwissSyrianThaiTohono O'OdhamTrinidadian and TobagonianTurkishUkrainianUteVenezuelanWelshWest IndianYaquiYugoslavian
Ancestry (Percentage)
AfghanAfricanAlaskan AthabascanAlbanianAlsatianAmericanApacheArabArapahoArgentineanArmenianAustralianAustrianBangladeshiBarbadianBasqueBelgianBelizeanBermudanBhutaneseBlackfeetBolivianBrazilianBritishBritish West IndianBulgarianBurmeseCajunCambodianCanadianCape VerdeanCarpatho RusynCelticCentral AmericanCentral American IndianCherokeeCheyenneChickasawChileanChineseChippewaChoctawColombianComancheCosta RicanCreeCreekCroatianCubanCzechCzechoslovakianDanishDelawareDominicanDutchEastern EuropeanEcuadorianEgyptianEnglishEstonianEthiopianEuropeanFilipinoFinnishFrenchFrench CanadianGermanGerman RussianGhanaianGreekGuamanian / ChamorroGuatemalanHaitianHonduranHopiHungarianIcelanderIndian (Asian)IndonesianInupiatIranianIraqiIrishIroquoisIsraeliItalianJamaicanJapaneseJordanianKenyanKoreanLaotianLatvianLebaneseLiberianLithuanianLuxembourgerMacedonianMalaysianMexicanMexican American IndianNative HawaiianNavajoNew ZealanderNicaraguanNigerianNorthern EuropeanNorwegianOkinawanOsagePakistaniPalestinianPanamanianPennsylvania GermanPeruvianPolishPortuguesePotawatomiPuebloPuerto RicanRomanianRussianSalvadoranSamoanScandinavianScotch-IrishScottishSeminoleSerbianShoshoneSiouxSlavicSlovakSloveneSomaliSouth AfricanSouth AmericanSouth American IndianSpaniardSpanishSpanish AmericanSpanish American IndianSri LankanSubsaharan AfricanSudaneseSwedishSwissSyrianThaiTohono O'OdhamTrinidadian and TobagonianTurkishUkrainianUteVenezuelanWelshWest IndianYaquiYugoslavian
Immigrant Origin (Total)
AfghanistanAfricaArgentinaArmeniaAsiaAustraliaAustriaBangladeshBarbadosBelarusBoliviaBosnia and HerzegovinaBrazilBulgariaBurma / MyanmarCambodiaCameroonCanadaCaribbeanCentral AmericaChileChinaColombiaCosta RicaCroatiaCubaCzechoslovakiaDenmarkDominican RepublicEastern AfricaEastern AsiaEastern EuropeEcuadorEgyptEl SalvadorEnglandEritreaEthiopiaEuropeFranceGermanyGhanaGuatemalaGuyanaHaitiHondurasHong KongHungaryIndiaIndonesiaIranIraqIrelandIsraelItalyJamaicaJapanKazakhstanKenyaKoreaLaosLatin AmericaLebanonLiberiaLithuaniaMexicoMiddle AfricaMoldovaNepalNetherlandsNicaraguaNigeriaNorth MacedoniaNorthern AfricaNorthern EuropeNorwayOceaniaPakistanPanamaPeruPhilippinesPolandRomaniaRussiaScotlandSingaporeSomaliaSouth AfricaSouth AmericaSouth Central AsiaSouth Eastern AsiaSouthern EuropeSpainSt. Vincent and the GrenadinesSwedenSwitzerlandSyriaTaiwanThailandTrinidad and TobagoTurkeyUgandaUkraineUzbekistanVenezuelaVietnamWest IndiesWestern AfricaWestern AsiaWestern EuropeZaireZimbabwe
Immigrant Origin (Percentage)
AfghanistanAfricaArgentinaArmeniaAsiaAustraliaAustriaBangladeshBarbadosBelarusBoliviaBosnia and HerzegovinaBrazilBulgariaBurma / MyanmarCambodiaCameroonCanadaCaribbeanCentral AmericaChileChinaColombiaCosta RicaCroatiaCubaCzechoslovakiaDenmarkDominican RepublicEastern AfricaEastern AsiaEastern EuropeEcuadorEgyptEl SalvadorEnglandEritreaEthiopiaEuropeFranceGermanyGhanaGuatemalaGuyanaHaitiHondurasHong KongHungaryIndiaIndonesiaIranIraqIrelandIsraelItalyJamaicaJapanKazakhstanKenyaKoreaLaosLatin AmericaLebanonLiberiaLithuaniaMexicoMiddle AfricaMoldovaNepalNetherlandsNicaraguaNigeriaNorth MacedoniaNorthern AfricaNorthern EuropeNorwayOceaniaPakistanPanamaPeruPhilippinesPolandRomaniaRussiaScotlandSingaporeSomaliaSouth AfricaSouth AmericaSouth Central AsiaSouth Eastern AsiaSouthern EuropeSpainSt. Vincent and the GrenadinesSwedenSwitzerlandSyriaTaiwanThailandTrinidad and TobagoTurkeyUgandaUkraineUzbekistanVenezuelaVietnamWest IndiesWestern AfricaWestern AsiaWestern EuropeZaireZimbabwe
Income
Income (Families)
Income (Households)
Poverty
Poverty (Families)
Unemployment
Employment Occupations
Employment Industries
Employer Class
Commute Time
Commute Means
School Enrollment
Education by Degree Field
Occupancy
Finances
Physical Characteristics
Colorado Springs
Compare Zip Codes
Comparison Subject

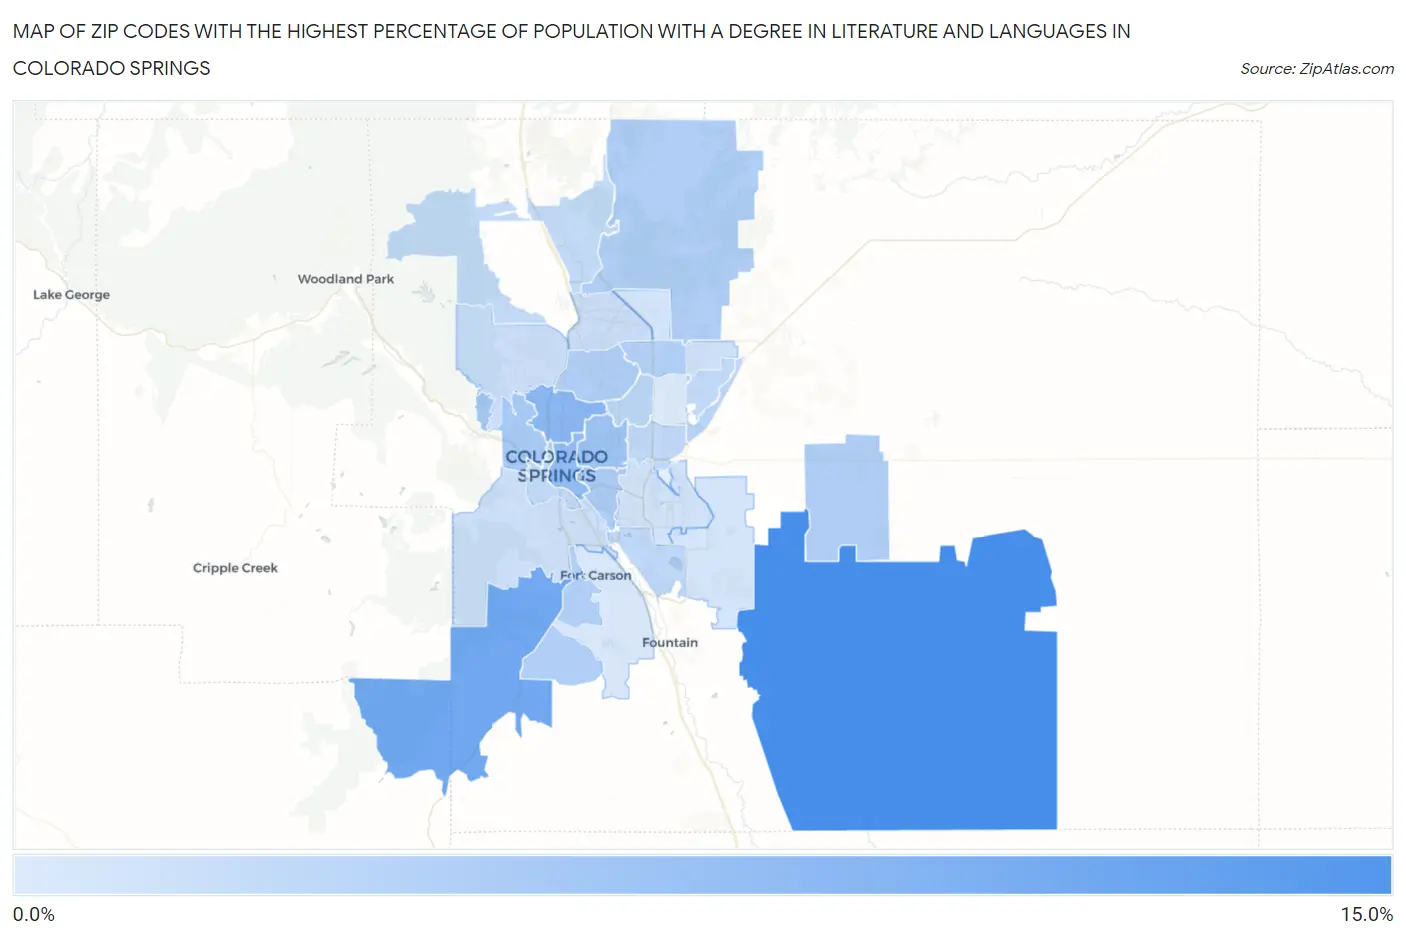
Map of Zip Codes with the Highest Percentage of Population with a Degree in Literature and Languages in Colorado Springs

0.0%
15.0%
Zip Codes with the Highest Percentage of Population with a Degree in Literature and Languages in Colorado Springs Map

Zip Codes with the Highest Percentage of Population with a Degree in Literature and Languages in Colorado Springs, CO

Zip Code % Graduates vs State vs National
1.8092813.2%4.6%(+8.62)#154.4%(+8.84)#1,019
2.8092610.1%4.6%(+5.45)#294.4%(+5.66)#1,788
3.809078.1%4.6%(+3.51)#504.4%(+3.72)#2,875
4.809037.4%4.6%(+2.79)#624.4%(+3.00)#3,534
5.809096.5%4.6%(+1.84)#844.4%(+2.05)#4,701
6.809045.8%4.6%(+1.21)#1014.4%(+1.42)#5,703
7.809105.6%4.6%(+0.942)#1174.4%(+1.16)#6,193
8.809305.4%4.6%(+0.782)#1254.4%(+0.996)#6,502
9.809025.2%4.6%(+0.562)#1344.4%(+0.776)#6,978
10.809185.2%4.6%(+0.548)#1364.4%(+0.761)#7,016
11.809085.1%4.6%(+0.474)#1384.4%(+0.688)#7,125
12.809234.9%4.6%(+0.316)#1464.4%(+0.530)#7,512
13.809514.6%4.6%(-0.044)#1634.4%(+0.170)#8,492
14.809174.4%4.6%(-0.223)#1744.4%(-0.009)#8,992
15.809114.1%4.6%(-0.494)#1924.4%(-0.280)#9,825
16.809384.0%4.6%(-0.646)#1994.4%(-0.432)#10,240
17.809153.9%4.6%(-0.700)#2024.4%(-0.486)#10,409
18.809213.9%4.6%(-0.747)#2094.4%(-0.533)#10,573
19.809053.8%4.6%(-0.801)#2124.4%(-0.587)#10,746
20.809193.3%4.6%(-1.35)#2504.4%(-1.13)#12,630
21.809203.3%4.6%(-1.36)#2534.4%(-1.14)#12,665
22.809063.2%4.6%(-1.47)#2614.4%(-1.25)#13,041
23.809273.1%4.6%(-1.56)#2644.4%(-1.35)#13,360
24.809162.8%4.6%(-1.83)#2794.4%(-1.62)#14,303
25.809242.7%4.6%(-1.89)#2824.4%(-1.67)#14,498
26.809252.6%4.6%(-2.00)#2894.4%(-1.78)#14,851
27.809132.3%4.6%(-2.36)#3144.4%(-2.15)#16,184
28.809222.0%4.6%(-2.61)#3244.4%(-2.40)#17,060

Common Questions

What are the Top 10 Zip Codes with the Highest Percentage of Population with a Degree in Literature and Languages in Colorado Springs, CO?
Top 10 Zip Codes with the Highest Percentage of Population with a Degree in Literature and Languages in Colorado Springs, CO are:
#1
13.2%
#2
10.1%
#3
8.1%
#4
7.4%
#5
6.5%
#6
5.8%
#7
5.6%
#8
5.4%
#9
5.2%
#10
5.2%
What zip code has the Highest Percentage of Population with a Degree in Literature and Languages in Colorado Springs, CO?
80928 has the Highest Percentage of Population with a Degree in Literature and Languages in Colorado Springs, CO with 13.2%.
What is the Percentage of Population with a Degree in Literature and Languages in Colorado Springs, CO?
Percentage of Population with a Degree in Literature and Languages in Colorado Springs is 4.4%.
What is the Percentage of Population with a Degree in Literature and Languages in Colorado?
Percentage of Population with a Degree in Literature and Languages in Colorado is 4.6%.
What is the Percentage of Population with a Degree in Literature and Languages in the United States?
Percentage of Population with a Degree in Literature and Languages in the United States is 4.4%.