Zip Codes with the Highest Percentage of Population Employed in Mining, Quarrying, & Extraction in Palmdale, CA

RELATED REPORTS & OPTIONS

Mining, Quarrying, & Extraction
Population
Families and Households
Female Fertility
Female Fertility (Unmarried)
Race (Community Size)
Race (Percentage)
Ancestry (Community Size)
AfricanAmericanApacheArabArgentineanArmenianAustralianBelizeanBhutaneseBlackfeetBolivianBrazilianBritishBurmeseCanadianCentral AmericanCentral American IndianCherokeeChileanChoctawColombianCosta RicanCreekCroatianCubanCzechDanishDutchEastern EuropeanEcuadorianEgyptianEnglishEuropeanFinnishFrenchFrench CanadianGermanGreekGuamanian / ChamorroGuatemalanHonduranHungarianIndian (Asian)IranianIrishItalianJamaicanJapaneseJordanianKoreanLaotianLebaneseLithuanianMexicanMexican American IndianNative HawaiianNavajoNicaraguanNigerianNorthern EuropeanNorwegianPakistaniPeruvianPolishPortuguesePuerto RicanRomanianRussianSalvadoranSamoanScandinavianScotch-IrishScottishSerbianSlavicSlovakSouth AmericanSpaniardSpanishSpanish AmericanSri LankanSubsaharan AfricanSwedishSwissThaiTonganUkrainianUruguayanVietnameseWelshYaqui
Ancestry (Percentage)
AfricanAmericanApacheArabArgentineanArmenianAustralianBelizeanBhutaneseBlackfeetBolivianBrazilianBritishBurmeseCanadianCentral AmericanCentral American IndianCherokeeChileanChoctawColombianCosta RicanCreekCroatianCubanCzechDanishDutchEastern EuropeanEcuadorianEgyptianEnglishEuropeanFinnishFrenchFrench CanadianGermanGreekGuamanian / ChamorroGuatemalanHonduranHungarianIndian (Asian)IranianIrishItalianJamaicanJapaneseJordanianKoreanLaotianLebaneseLithuanianMexicanMexican American IndianNative HawaiianNavajoNicaraguanNigerianNorthern EuropeanNorwegianPakistaniPeruvianPolishPortuguesePuerto RicanRomanianRussianSalvadoranSamoanScandinavianScotch-IrishScottishSerbianSlavicSlovakSouth AmericanSpaniardSpanishSpanish AmericanSri LankanSubsaharan AfricanSwedishSwissThaiTonganUkrainianUruguayanVietnameseWelshYaqui
Immigrant Origin (Total)
Immigrant Origin (Percentage)
Income
Income (Families)
Income (Households)
Poverty
Poverty (Families)
Unemployment
Employment Occupations
Employment Industries
Employer Class
Commute Time
Commute Means
School Enrollment
Education by Degree Field
Occupancy
Finances
Physical Characteristics
Palmdale
Compare Zip Codes
Comparison Subject

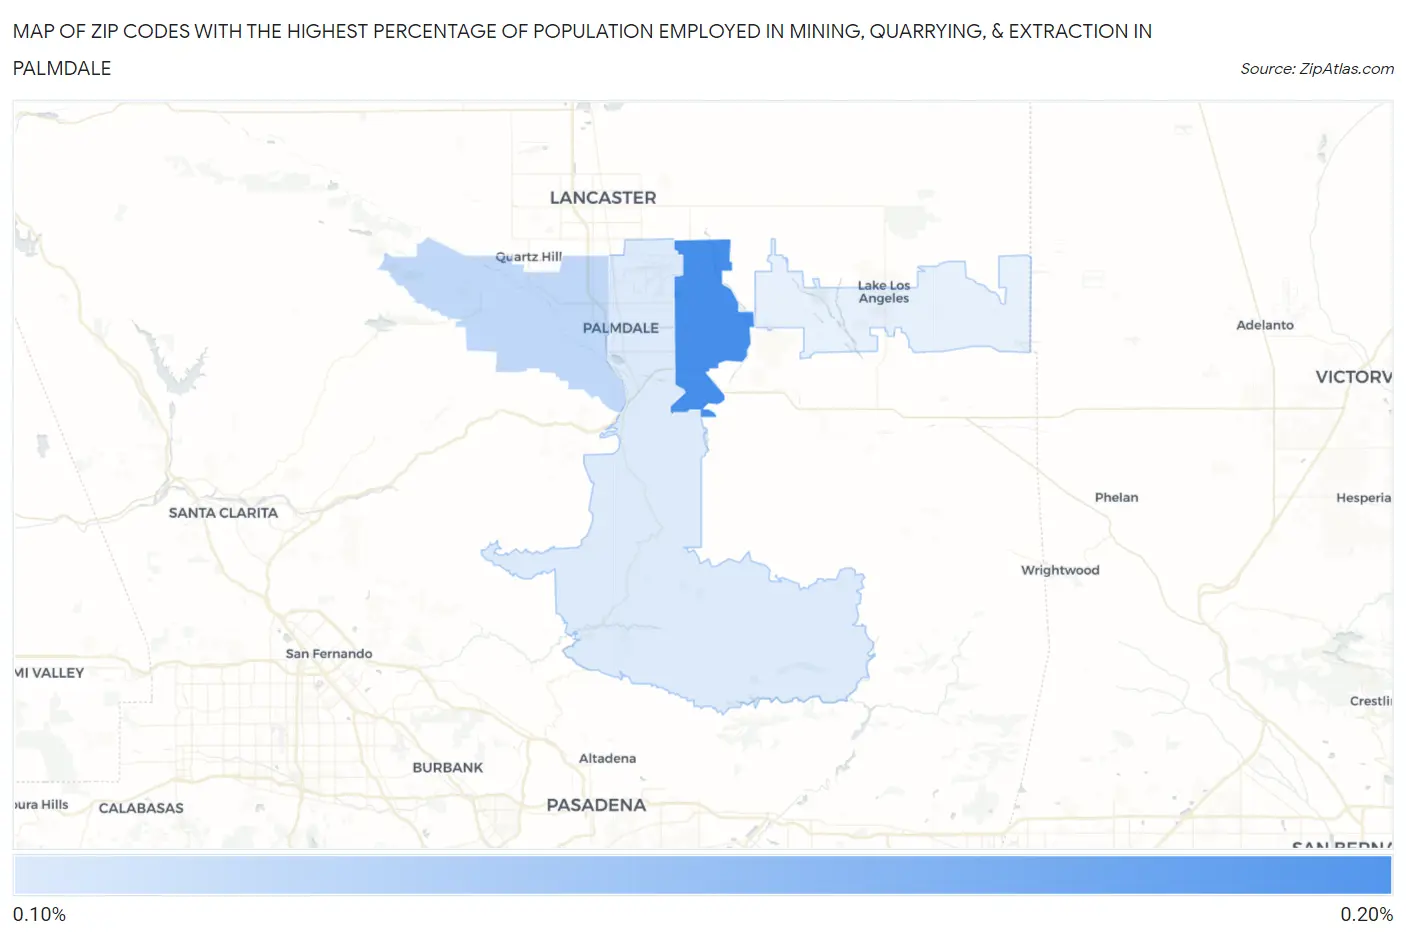
Map of Zip Codes with the Highest Percentage of Population Employed in Mining, Quarrying, & Extraction in Palmdale

0.0%
0.20%
Zip Codes with the Highest Percentage of Population Employed in Mining, Quarrying, & Extraction in Palmdale Map

Zip Codes with the Highest Percentage of Population Employed in Mining, Quarrying, & Extraction in Palmdale, CA

Zip Code % Employed vs State vs National
1.935520.20%0.12%(+0.072)#2010.44%(-0.245)#9,562
2.935510.12%0.12%(-0.002)#2780.44%(-0.319)#10,490
3.935500.10%0.12%(-0.021)#3170.44%(-0.338)#10,795

Common Questions

What are the Top 3 Zip Codes with the Highest Percentage of Population Employed in Mining, Quarrying, & Extraction in Palmdale, CA?
Top 3 Zip Codes with the Highest Percentage of Population Employed in Mining, Quarrying, & Extraction in Palmdale, CA are:
#1
0.20%
#2
0.12%
#3
0.10%
What zip code has the Highest Percentage of Population Employed in Mining, Quarrying, & Extraction in Palmdale, CA?
93552 has the Highest Percentage of Population Employed in Mining, Quarrying, & Extraction in Palmdale, CA with 0.20%.
What is the Percentage of Population Employed in Mining, Quarrying, & Extraction in Palmdale, CA?
Percentage of Population Employed in Mining, Quarrying, & Extraction in Palmdale is 0.14%.
What is the Percentage of Population Employed in Mining, Quarrying, & Extraction in California?
Percentage of Population Employed in Mining, Quarrying, & Extraction in California is 0.12%.
What is the Percentage of Population Employed in Mining, Quarrying, & Extraction in the United States?
Percentage of Population Employed in Mining, Quarrying, & Extraction in the United States is 0.44%.