Zip Codes with the Highest Percentage of Population Employed in Mining, Quarrying, & Extraction in Bakersfield, CA

RELATED REPORTS & OPTIONS

Mining, Quarrying, & Extraction
Population
Families and Households
Female Fertility
Female Fertility (Unmarried)
Race (Community Size)
Race (Percentage)
Ancestry (Community Size)
AfghanAfricanAlaska NativeAmericanApacheArabArgentineanArmenianAustralianAustrianBangladeshiBasqueBelgianBelizeanBhutaneseBlackfeetBolivianBrazilianBritishBulgarianBurmeseCanadianCentral AmericanCentral American IndianCherokeeCheyenneChickasawChippewaChoctawColombianComancheCosta RicanCreeCreekCroatianCubanCzechCzechoslovakianDanishDominicanDutchDutch West IndianEastern EuropeanEcuadorianEgyptianEnglishEthiopianEuropeanFilipinoFinnishFrenchFrench American IndianFrench CanadianGermanGhanaianGreekGuamanian / ChamorroGuatemalanHaitianHonduranHopiHungarianIndian (Asian)IndonesianIranianIrishIroquoisItalianJamaicanJapaneseJordanianKiowaKoreanLaotianLatvianLebaneseLithuanianLumbeeLuxembourgerMalaysianMexicanMexican American IndianMongolianMoroccanNative HawaiianNavajoNicaraguanNigerianNorthern EuropeanNorwegianPaiutePakistaniPalestinianPanamanianPeruvianPolishPortuguesePotawatomiPuebloPuerto RicanRomanianRussianSalvadoranSamoanScandinavianScotch-IrishScottishSeminoleSerbianSiouxSlavicSlovakSouth AfricanSouth AmericanSouth American IndianSpaniardSpanishSpanish AmericanSri LankanSubsaharan AfricanSwedishSwissSyrianThaiTonganTurkishUkrainianVenezuelanVietnameseWelshWest IndianYaquiYugoslavian
Ancestry (Percentage)
AfghanAfricanAlaska NativeAmericanApacheArabArgentineanArmenianAustralianAustrianBangladeshiBasqueBelgianBelizeanBhutaneseBlackfeetBolivianBrazilianBritishBulgarianBurmeseCanadianCentral AmericanCentral American IndianCherokeeCheyenneChickasawChippewaChoctawColombianComancheCosta RicanCreeCreekCroatianCubanCzechCzechoslovakianDanishDominicanDutchDutch West IndianEastern EuropeanEcuadorianEgyptianEnglishEthiopianEuropeanFilipinoFinnishFrenchFrench American IndianFrench CanadianGermanGhanaianGreekGuamanian / ChamorroGuatemalanHaitianHonduranHopiHungarianIndian (Asian)IndonesianIranianIrishIroquoisItalianJamaicanJapaneseJordanianKiowaKoreanLaotianLatvianLebaneseLithuanianLumbeeLuxembourgerMalaysianMexicanMexican American IndianMongolianMoroccanNative HawaiianNavajoNicaraguanNigerianNorthern EuropeanNorwegianPaiutePakistaniPalestinianPanamanianPeruvianPolishPortuguesePotawatomiPuebloPuerto RicanRomanianRussianSalvadoranSamoanScandinavianScotch-IrishScottishSeminoleSerbianSiouxSlavicSlovakSouth AfricanSouth AmericanSouth American IndianSpaniardSpanishSpanish AmericanSri LankanSubsaharan AfricanSwedishSwissSyrianThaiTonganTurkishUkrainianVenezuelanVietnameseWelshWest IndianYaquiYugoslavian
Immigrant Origin (Total)
Immigrant Origin (Percentage)
Income
Income (Families)
Income (Households)
Poverty
Poverty (Families)
Unemployment
Employment Occupations
Employment Industries
Employer Class
Commute Time
Commute Means
School Enrollment
Education by Degree Field
Occupancy
Finances
Physical Characteristics
Bakersfield
Compare Zip Codes
Comparison Subject

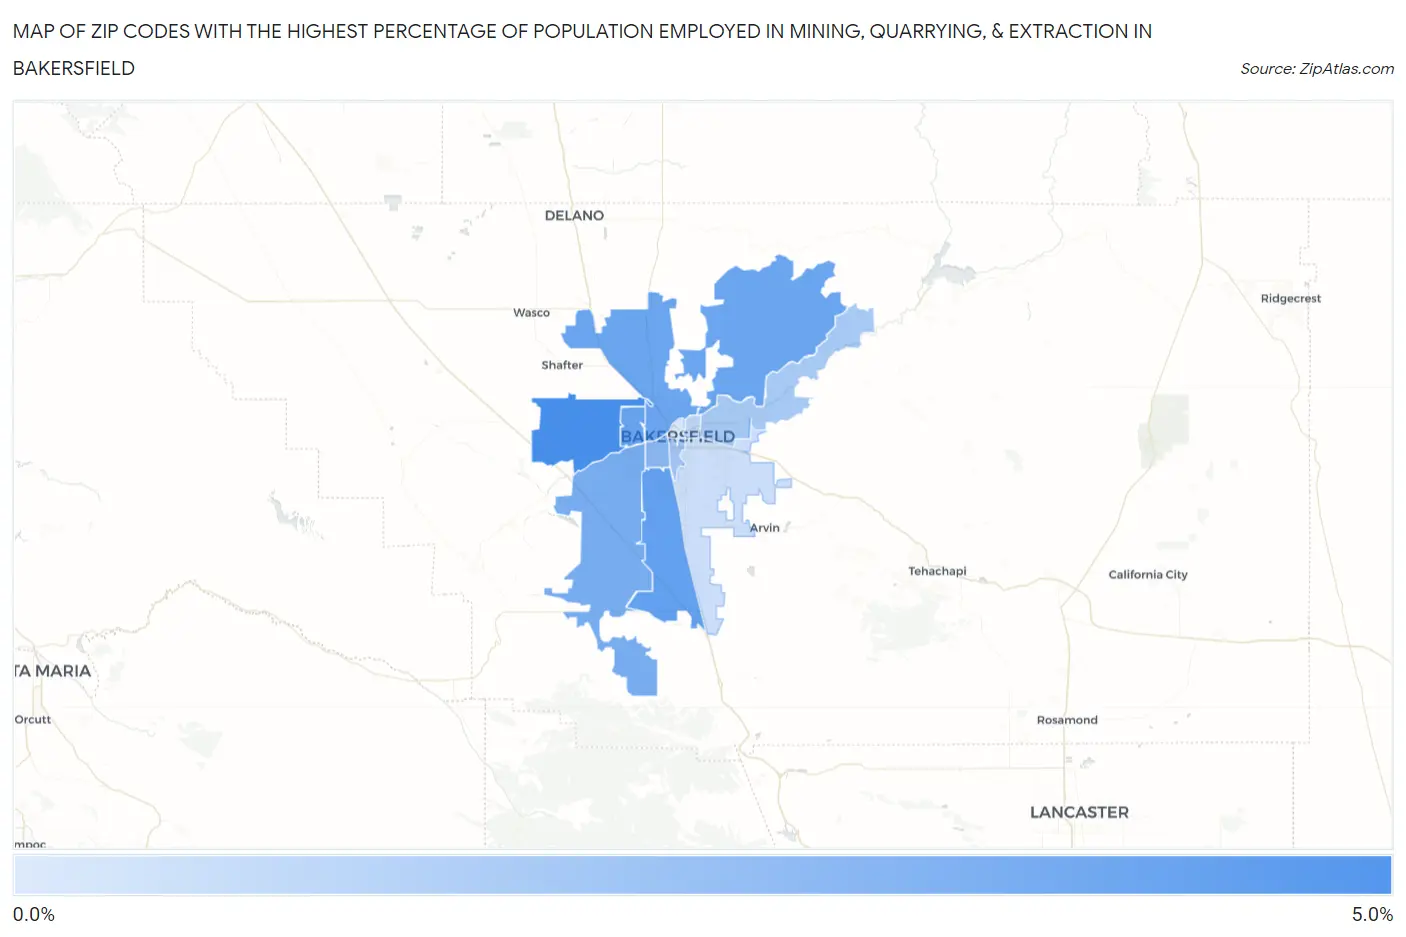
Map of Zip Codes with the Highest Percentage of Population Employed in Mining, Quarrying, & Extraction in Bakersfield

0.0%
5.0%
Zip Codes with the Highest Percentage of Population Employed in Mining, Quarrying, & Extraction in Bakersfield Map

Zip Codes with the Highest Percentage of Population Employed in Mining, Quarrying, & Extraction in Bakersfield, CA

Zip Code % Employed vs State vs National
1.933145.0%0.12%(+4.85)#170.44%(+4.53)#1,781
2.933134.2%0.12%(+4.09)#210.44%(+3.77)#2,048
3.933124.0%0.12%(+3.89)#220.44%(+3.58)#2,128
4.933083.9%0.12%(+3.82)#230.44%(+3.51)#2,169
5.933113.7%0.12%(+3.53)#270.44%(+3.21)#2,325
6.933093.1%0.12%(+3.01)#300.44%(+2.70)#2,640
7.933042.5%0.12%(+2.37)#390.44%(+2.05)#3,140
8.933062.3%0.12%(+2.17)#420.44%(+1.85)#3,328
9.933051.8%0.12%(+1.64)#520.44%(+1.33)#3,938
10.933071.4%0.12%(+1.27)#620.44%(+0.952)#4,556
11.933010.88%0.12%(+0.759)#770.44%(+0.441)#5,705

Common Questions

What are the Top 10 Zip Codes with the Highest Percentage of Population Employed in Mining, Quarrying, & Extraction in Bakersfield, CA?
Top 10 Zip Codes with the Highest Percentage of Population Employed in Mining, Quarrying, & Extraction in Bakersfield, CA are:
#1
5.0%
#2
4.2%
#3
4.0%
#4
3.9%
#5
3.7%
#6
3.1%
#7
2.5%
#8
2.3%
#9
1.8%
#10
1.4%
What zip code has the Highest Percentage of Population Employed in Mining, Quarrying, & Extraction in Bakersfield, CA?
93314 has the Highest Percentage of Population Employed in Mining, Quarrying, & Extraction in Bakersfield, CA with 5.0%.
What is the Percentage of Population Employed in Mining, Quarrying, & Extraction in Bakersfield, CA?
Percentage of Population Employed in Mining, Quarrying, & Extraction in Bakersfield is 2.8%.
What is the Percentage of Population Employed in Mining, Quarrying, & Extraction in California?
Percentage of Population Employed in Mining, Quarrying, & Extraction in California is 0.12%.
What is the Percentage of Population Employed in Mining, Quarrying, & Extraction in the United States?
Percentage of Population Employed in Mining, Quarrying, & Extraction in the United States is 0.44%.