Zip Codes with the Highest Percentage of Population with a Degree in Liberal Arts and History in Cheyenne, WY
RELATED REPORTS & OPTIONS
Liberal Arts and History
Cheyenne
Compare Zip Codes
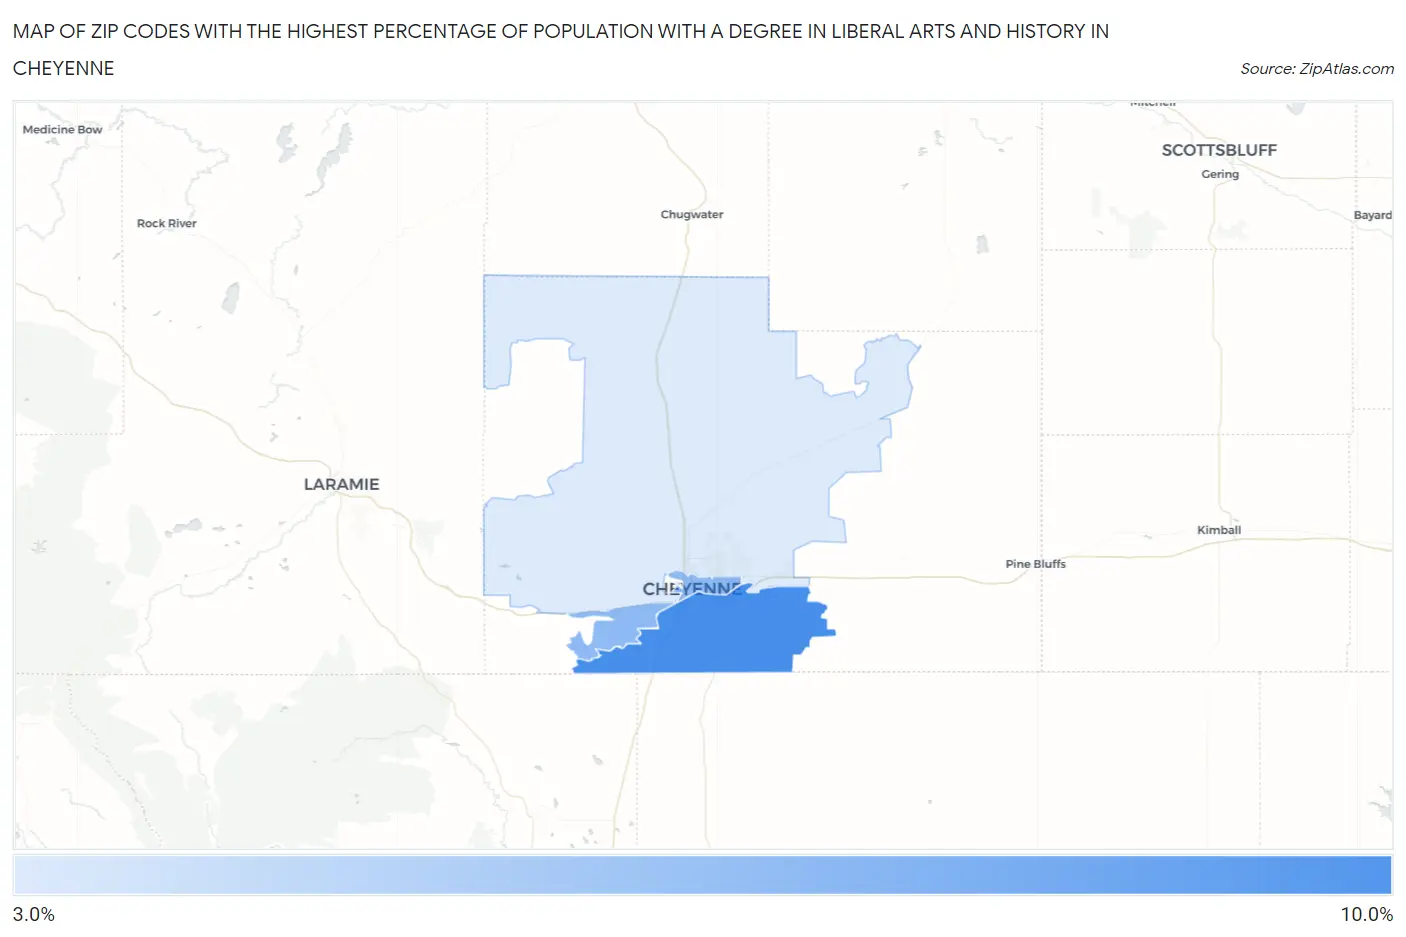
Map of Zip Codes with the Highest Percentage of Population with a Degree in Liberal Arts and History in Cheyenne
0.0%
10.0%
Zip Codes with the Highest Percentage of Population with a Degree in Liberal Arts and History in Cheyenne, WY
| Zip Code | % Graduates | vs State | vs National | |
| 1. | 82007 | 8.4% | 4.7%(+3.65)#23 | 4.9%(+3.51)#4,457 |
| 2. | 82001 | 5.9% | 4.7%(+1.15)#36 | 4.9%(+1.01)#8,840 |
| 3. | 82009 | 3.1% | 4.7%(-1.60)#61 | 4.9%(-1.74)#17,892 |
1
Common Questions
What are the Top Zip Codes with the Highest Percentage of Population with a Degree in Liberal Arts and History in Cheyenne, WY?
Top Zip Codes with the Highest Percentage of Population with a Degree in Liberal Arts and History in Cheyenne, WY are:
What zip code has the Highest Percentage of Population with a Degree in Liberal Arts and History in Cheyenne, WY?
82007 has the Highest Percentage of Population with a Degree in Liberal Arts and History in Cheyenne, WY with 8.4%.
What is the Percentage of Population with a Degree in Liberal Arts and History in Cheyenne, WY?
Percentage of Population with a Degree in Liberal Arts and History in Cheyenne is 5.7%.
What is the Percentage of Population with a Degree in Liberal Arts and History in Wyoming?
Percentage of Population with a Degree in Liberal Arts and History in Wyoming is 4.7%.
What is the Percentage of Population with a Degree in Liberal Arts and History in the United States?
Percentage of Population with a Degree in Liberal Arts and History in the United States is 4.9%.