Zip Codes with the Highest Percentage of Population Employed in Administrative & Support Services in Cheyenne, WY
RELATED REPORTS & OPTIONS
Administrative & Support Services
Cheyenne
Compare Zip Codes
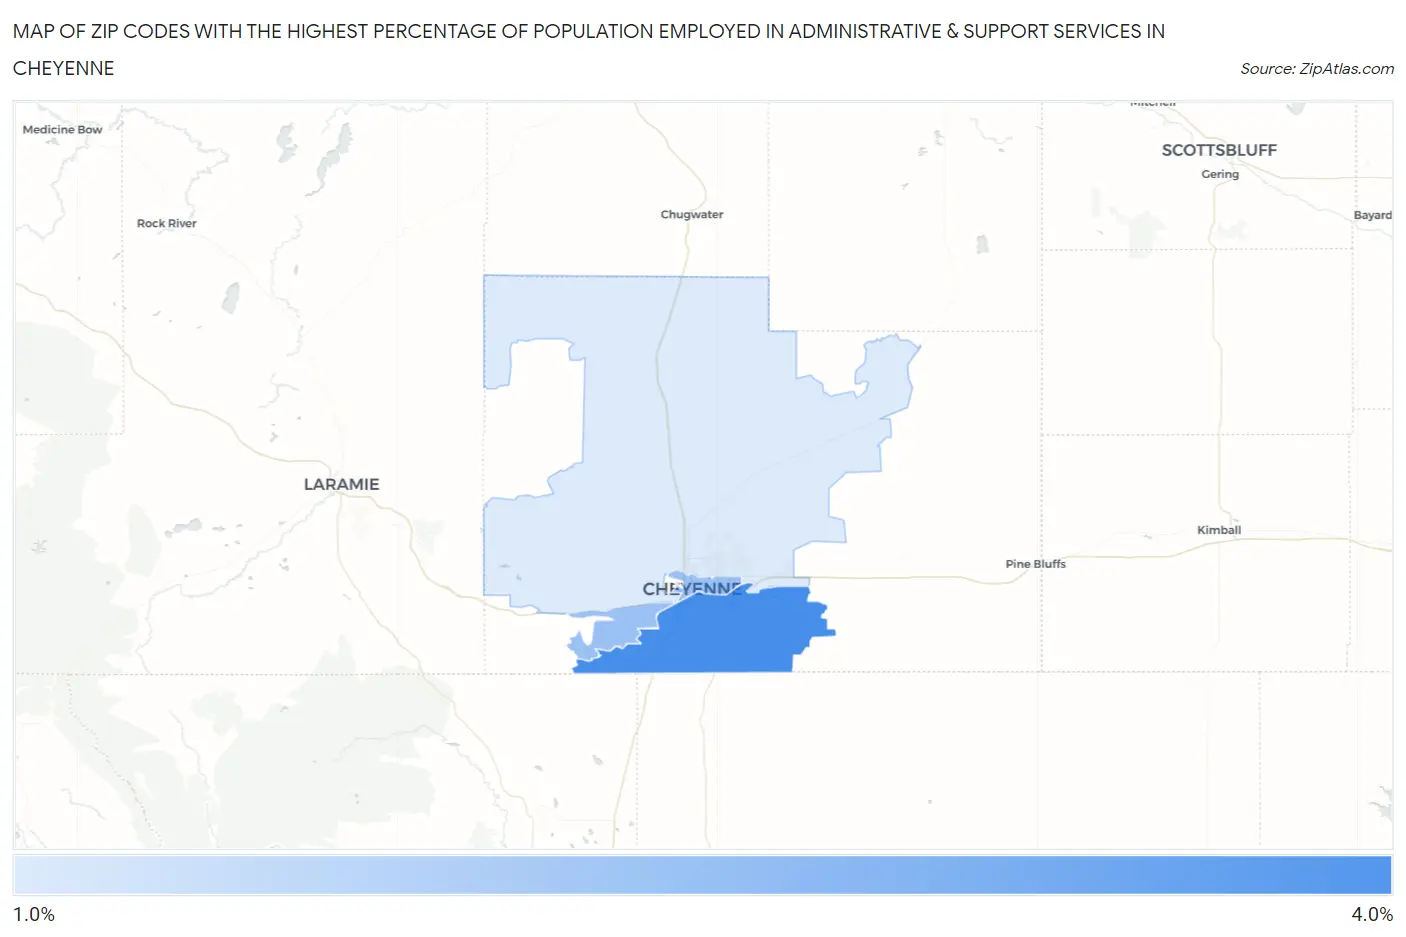
Map of Zip Codes with the Highest Percentage of Population Employed in Administrative & Support Services in Cheyenne
0.0%
4.0%
Zip Codes with the Highest Percentage of Population Employed in Administrative & Support Services in Cheyenne, WY
| Zip Code | % Employed | vs State | vs National | |
| 1. | 82007 | 3.0% | 2.4%(+0.587)#41 | 4.1%(-1.12)#15,309 |
| 2. | 82001 | 2.4% | 2.4%(-0.037)#59 | 4.1%(-1.74)#18,610 |
| 3. | 82009 | 1.9% | 2.4%(-0.543)#65 | 4.1%(-2.25)#21,081 |
1
Common Questions
What are the Top Zip Codes with the Highest Percentage of Population Employed in Administrative & Support Services in Cheyenne, WY?
Top Zip Codes with the Highest Percentage of Population Employed in Administrative & Support Services in Cheyenne, WY are:
What zip code has the Highest Percentage of Population Employed in Administrative & Support Services in Cheyenne, WY?
82007 has the Highest Percentage of Population Employed in Administrative & Support Services in Cheyenne, WY with 3.0%.
What is the Percentage of Population Employed in Administrative & Support Services in Cheyenne, WY?
Percentage of Population Employed in Administrative & Support Services in Cheyenne is 2.2%.
What is the Percentage of Population Employed in Administrative & Support Services in Wyoming?
Percentage of Population Employed in Administrative & Support Services in Wyoming is 2.4%.
What is the Percentage of Population Employed in Administrative & Support Services in the United States?
Percentage of Population Employed in Administrative & Support Services in the United States is 4.1%.