Zip Codes with the Highest Percentage of Population Employed in Food Preparation & Serving in South Charleston, WV
RELATED REPORTS & OPTIONS
Food Preparation & Serving
South Charleston
Compare Zip Codes
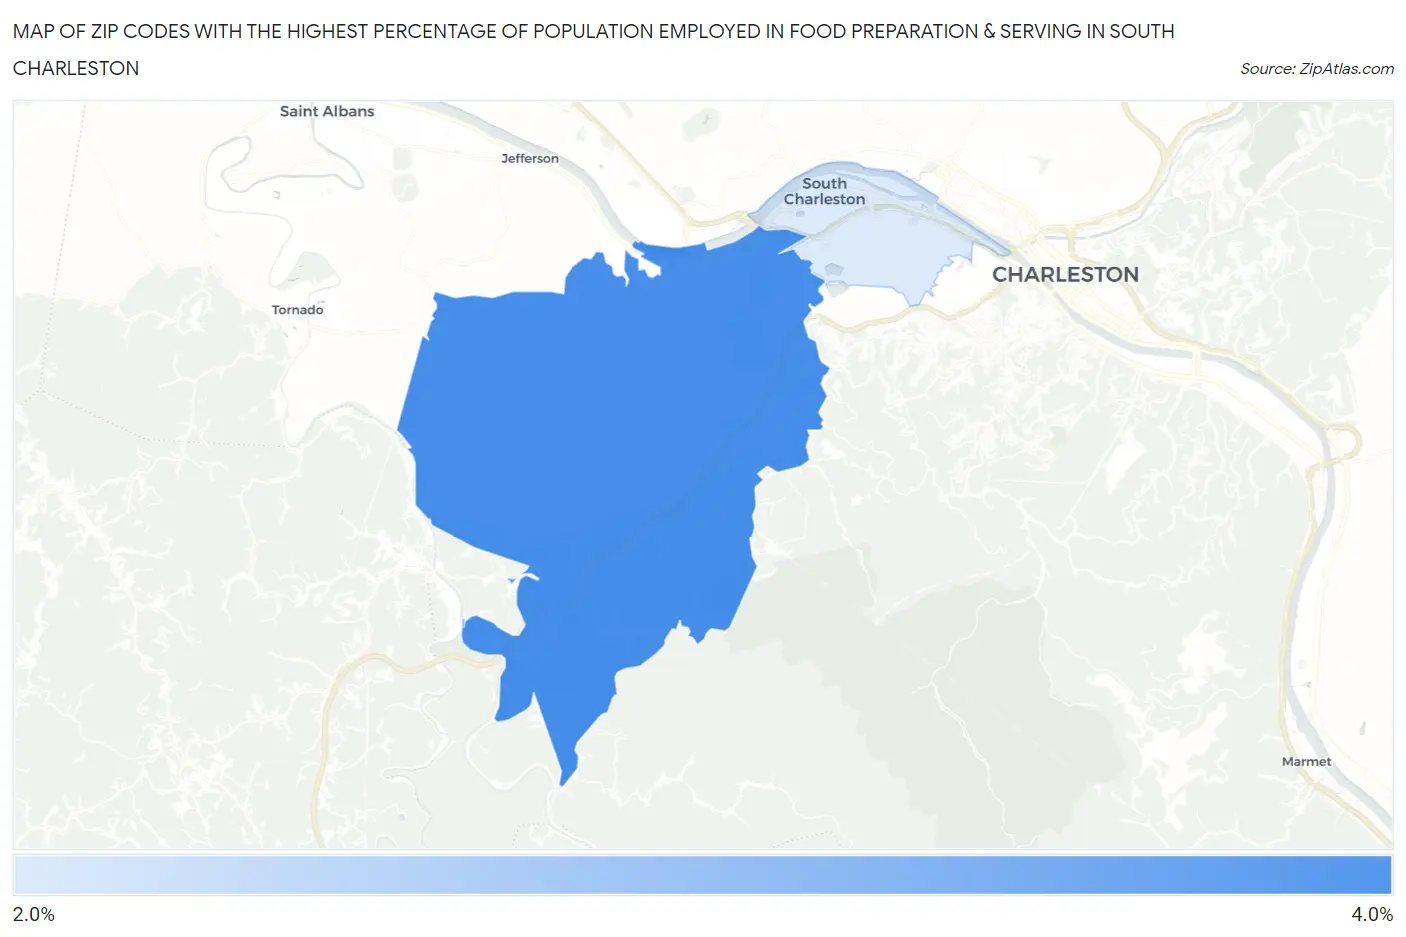
Map of Zip Codes with the Highest Percentage of Population Employed in Food Preparation & Serving in South Charleston
0.0%
4.0%
Zip Codes with the Highest Percentage of Population Employed in Food Preparation & Serving in South Charleston, WV
| Zip Code | % Employed | vs State | vs National | |
| 1. | 25309 | 3.3% | 5.7%(-2.31)#297 | 5.3%(-1.94)#19,838 |
| 2. | 25303 | 2.5% | 5.7%(-3.16)#331 | 5.3%(-2.79)#23,155 |
1
Common Questions
What are the Top Zip Codes with the Highest Percentage of Population Employed in Food Preparation & Serving in South Charleston, WV?
Top Zip Codes with the Highest Percentage of Population Employed in Food Preparation & Serving in South Charleston, WV are:
What zip code has the Highest Percentage of Population Employed in Food Preparation & Serving in South Charleston, WV?
25309 has the Highest Percentage of Population Employed in Food Preparation & Serving in South Charleston, WV with 3.3%.
What is the Percentage of Population Employed in Food Preparation & Serving in South Charleston, WV?
Percentage of Population Employed in Food Preparation & Serving in South Charleston is 2.7%.
What is the Percentage of Population Employed in Food Preparation & Serving in West Virginia?
Percentage of Population Employed in Food Preparation & Serving in West Virginia is 5.7%.
What is the Percentage of Population Employed in Food Preparation & Serving in the United States?
Percentage of Population Employed in Food Preparation & Serving in the United States is 5.3%.