Ute vs Immigrants from Pakistan No Vehicles in Household
COMPARE
Ute
Immigrants from Pakistan
No Vehicles in Household
No Vehicles in Household Comparison
Ute
Immigrants from Pakistan
11.6%
NO VEHICLES IN HOUSEHOLD
3.3/ 100
METRIC RATING
237th/ 347
METRIC RANK
11.4%
NO VEHICLES IN HOUSEHOLD
5.4/ 100
METRIC RATING
227th/ 347
METRIC RANK
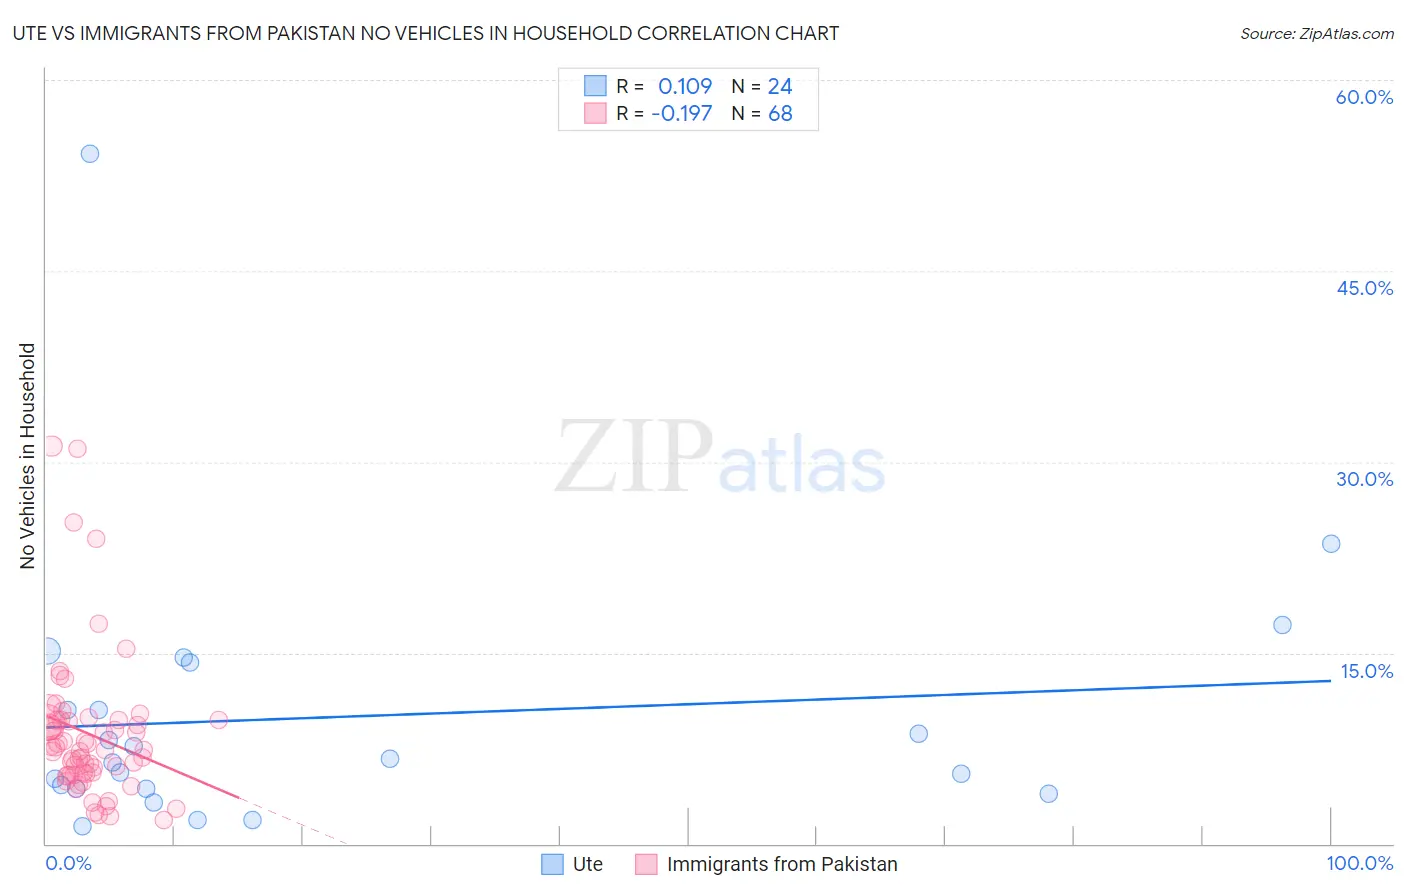
Ute vs Immigrants from Pakistan No Vehicles in Household Correlation Chart
The statistical analysis conducted on geographies consisting of 55,604,944 people shows a poor positive correlation between the proportion of Ute and percentage of households with no vehicle available in the United States with a correlation coefficient (R) of 0.109 and weighted average of 11.6%. Similarly, the statistical analysis conducted on geographies consisting of 283,461,123 people shows a poor negative correlation between the proportion of Immigrants from Pakistan and percentage of households with no vehicle available in the United States with a correlation coefficient (R) of -0.197 and weighted average of 11.4%, a difference of 1.6%.
No Vehicles in Household Correlation Summary
| Measurement | Ute | Immigrants from Pakistan |
| Minimum | 1.3% | 1.9% |
| Maximum | 54.2% | 31.2% |
| Range | 52.9% | 29.4% |
| Mean | 10.0% | 8.6% |
| Median | 6.5% | 7.4% |
| Interquartile 25% (IQ1) | 4.3% | 5.5% |
| Interquartile 75% (IQ3) | 12.4% | 9.7% |
| Interquartile Range (IQR) | 8.1% | 4.3% |
| Standard Deviation (Sample) | 10.9% | 5.8% |
| Standard Deviation (Population) | 10.7% | 5.7% |
Demographics Similar to Ute and Immigrants from Pakistan by No Vehicles in Household
In terms of no vehicles in household, the demographic groups most similar to Ute are Russian (11.6%, a difference of 0.050%), Cree (11.6%, a difference of 0.24%), Taiwanese (11.7%, a difference of 0.51%), Immigrants (11.7%, a difference of 0.57%), and Eastern European (11.7%, a difference of 0.58%). Similarly, the demographic groups most similar to Immigrants from Pakistan are Immigrants from Somalia (11.4%, a difference of 0.020%), Immigrants from Romania (11.4%, a difference of 0.040%), Ugandan (11.4%, a difference of 0.080%), Immigrants from Norway (11.4%, a difference of 0.21%), and Immigrants from Japan (11.4%, a difference of 0.21%).
| Demographics | Rating | Rank | No Vehicles in Household |
| Immigrants | South America | 8.0 /100 | #222 | Tragic 11.3% |
| Uruguayans | 7.7 /100 | #223 | Tragic 11.3% |
| Immigrants | Hong Kong | 7.2 /100 | #224 | Tragic 11.3% |
| Immigrants | Sierra Leone | 6.4 /100 | #225 | Tragic 11.3% |
| Immigrants | Somalia | 5.4 /100 | #226 | Tragic 11.4% |
| Immigrants | Pakistan | 5.4 /100 | #227 | Tragic 11.4% |
| Immigrants | Romania | 5.3 /100 | #228 | Tragic 11.4% |
| Ugandans | 5.3 /100 | #229 | Tragic 11.4% |
| Immigrants | Norway | 5.1 /100 | #230 | Tragic 11.4% |
| Immigrants | Japan | 5.1 /100 | #231 | Tragic 11.4% |
| Immigrants | Turkey | 4.8 /100 | #232 | Tragic 11.5% |
| Houma | 4.7 /100 | #233 | Tragic 11.5% |
| Immigrants | Peru | 4.5 /100 | #234 | Tragic 11.5% |
| Kiowa | 4.0 /100 | #235 | Tragic 11.5% |
| Cree | 3.5 /100 | #236 | Tragic 11.6% |
| Ute | 3.3 /100 | #237 | Tragic 11.6% |
| Russians | 3.2 /100 | #238 | Tragic 11.6% |
| Taiwanese | 2.8 /100 | #239 | Tragic 11.7% |
| Immigrants | Immigrants | 2.7 /100 | #240 | Tragic 11.7% |
| Eastern Europeans | 2.7 /100 | #241 | Tragic 11.7% |
| Turks | 2.6 /100 | #242 | Tragic 11.7% |