Swiss vs Scandinavian No Vehicles in Household
COMPARE
Swiss
Scandinavian
No Vehicles in Household
No Vehicles in Household Comparison
Swiss
Scandinavians
7.9%
NO VEHICLES IN HOUSEHOLD
99.9/ 100
METRIC RATING
42nd/ 347
METRIC RANK
7.0%
NO VEHICLES IN HOUSEHOLD
100.0/ 100
METRIC RATING
13th/ 347
METRIC RANK
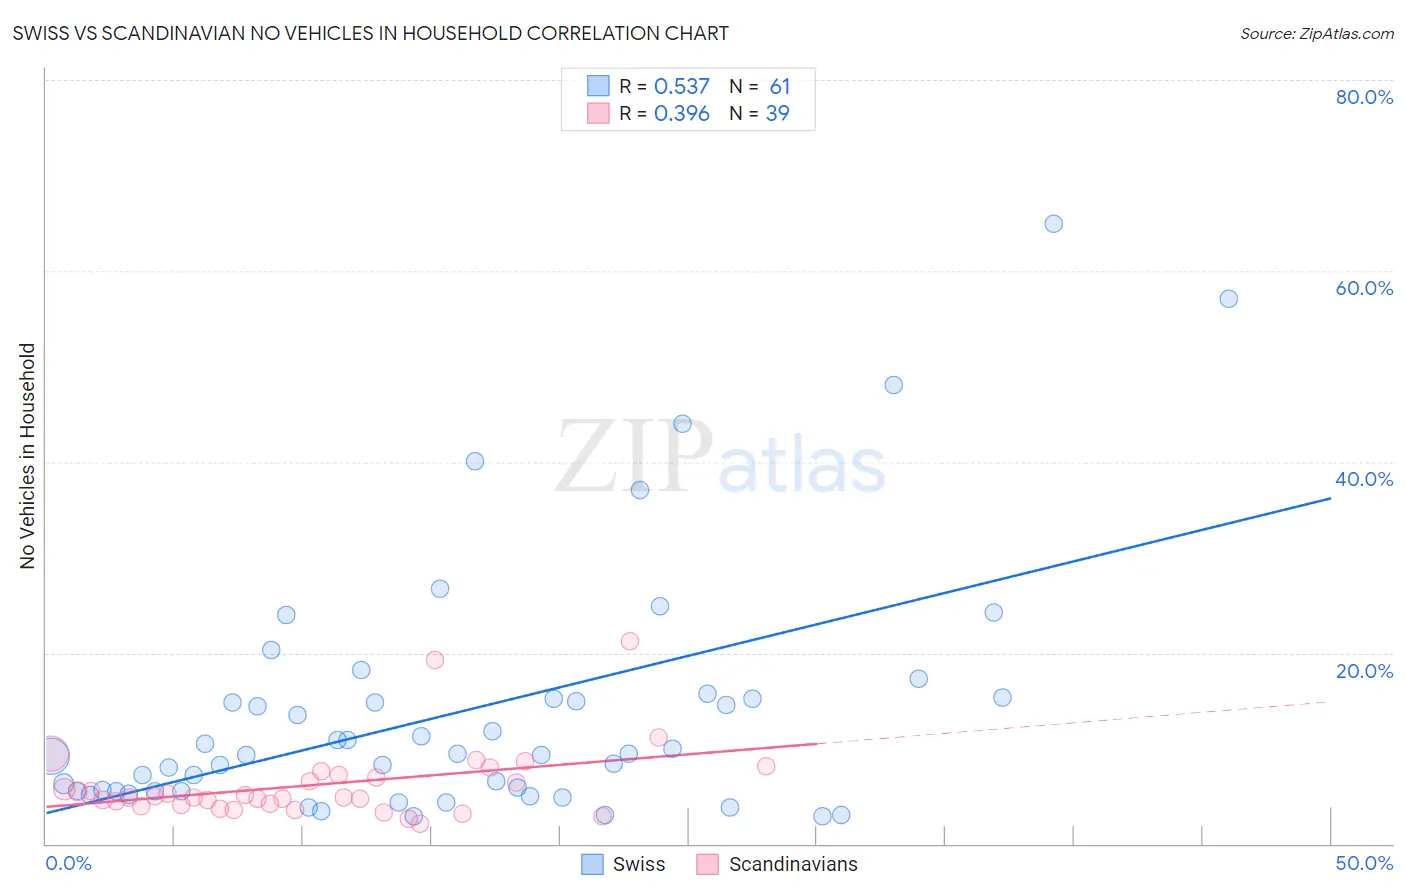
Swiss vs Scandinavian No Vehicles in Household Correlation Chart
The statistical analysis conducted on geographies consisting of 462,788,069 people shows a substantial positive correlation between the proportion of Swiss and percentage of households with no vehicle available in the United States with a correlation coefficient (R) of 0.537 and weighted average of 7.9%. Similarly, the statistical analysis conducted on geographies consisting of 470,073,757 people shows a mild positive correlation between the proportion of Scandinavians and percentage of households with no vehicle available in the United States with a correlation coefficient (R) of 0.396 and weighted average of 7.0%, a difference of 11.9%.
No Vehicles in Household Correlation Summary
| Measurement | Swiss | Scandinavian |
| Minimum | 2.8% | 2.0% |
| Maximum | 65.0% | 21.2% |
| Range | 62.2% | 19.2% |
| Mean | 14.0% | 6.2% |
| Median | 9.4% | 4.9% |
| Interquartile 25% (IQ1) | 5.5% | 4.0% |
| Interquartile 75% (IQ3) | 15.2% | 7.2% |
| Interquartile Range (IQR) | 9.7% | 3.2% |
| Standard Deviation (Sample) | 13.3% | 3.9% |
| Standard Deviation (Population) | 13.1% | 3.8% |
Similar Demographics by No Vehicles in Household
Demographics Similar to Swiss by No Vehicles in Household
In terms of no vehicles in household, the demographic groups most similar to Swiss are Chickasaw (7.9%, a difference of 0.080%), French Canadian (7.8%, a difference of 0.14%), Czechoslovakian (7.8%, a difference of 0.28%), Immigrants from Fiji (7.8%, a difference of 0.38%), and Choctaw (7.9%, a difference of 0.44%).
| Demographics | Rating | Rank | No Vehicles in Household |
| Cherokee | 99.9 /100 | #35 | Exceptional 7.7% |
| Iraqis | 99.9 /100 | #36 | Exceptional 7.7% |
| Basques | 99.9 /100 | #37 | Exceptional 7.8% |
| Creek | 99.9 /100 | #38 | Exceptional 7.8% |
| Immigrants | Fiji | 99.9 /100 | #39 | Exceptional 7.8% |
| Czechoslovakians | 99.9 /100 | #40 | Exceptional 7.8% |
| French Canadians | 99.9 /100 | #41 | Exceptional 7.8% |
| Swiss | 99.9 /100 | #42 | Exceptional 7.9% |
| Chickasaw | 99.9 /100 | #43 | Exceptional 7.9% |
| Choctaw | 99.9 /100 | #44 | Exceptional 7.9% |
| Immigrants | Nonimmigrants | 99.9 /100 | #45 | Exceptional 7.9% |
| Spanish | 99.9 /100 | #46 | Exceptional 7.9% |
| Northern Europeans | 99.9 /100 | #47 | Exceptional 7.9% |
| Afghans | 99.9 /100 | #48 | Exceptional 8.0% |
| Guamanians/Chamorros | 99.9 /100 | #49 | Exceptional 8.0% |
Demographics Similar to Scandinavians by No Vehicles in Household
In terms of no vehicles in household, the demographic groups most similar to Scandinavians are Mexican (7.0%, a difference of 0.17%), White/Caucasian (7.0%, a difference of 0.30%), Assyrian/Chaldean/Syriac (7.0%, a difference of 0.50%), European (7.1%, a difference of 1.5%), and Czech (6.9%, a difference of 1.9%).
| Demographics | Rating | Rank | No Vehicles in Household |
| Germans | 100.0 /100 | #6 | Exceptional 6.7% |
| Scottish | 100.0 /100 | #7 | Exceptional 6.8% |
| Swedes | 100.0 /100 | #8 | Exceptional 6.8% |
| Scotch-Irish | 100.0 /100 | #9 | Exceptional 6.8% |
| Dutch | 100.0 /100 | #10 | Exceptional 6.8% |
| Czechs | 100.0 /100 | #11 | Exceptional 6.9% |
| Assyrians/Chaldeans/Syriacs | 100.0 /100 | #12 | Exceptional 7.0% |
| Scandinavians | 100.0 /100 | #13 | Exceptional 7.0% |
| Mexicans | 100.0 /100 | #14 | Exceptional 7.0% |
| Whites/Caucasians | 100.0 /100 | #15 | Exceptional 7.0% |
| Europeans | 100.0 /100 | #16 | Exceptional 7.1% |
| Welsh | 100.0 /100 | #17 | Exceptional 7.2% |
| Tongans | 100.0 /100 | #18 | Exceptional 7.2% |
| Arapaho | 100.0 /100 | #19 | Exceptional 7.4% |
| Ottawa | 100.0 /100 | #20 | Exceptional 7.4% |