Swiss vs New Zealander No Vehicles in Household
COMPARE
Swiss
New Zealander
No Vehicles in Household
No Vehicles in Household Comparison
Swiss
New Zealanders
7.9%
NO VEHICLES IN HOUSEHOLD
99.9/ 100
METRIC RATING
42nd/ 347
METRIC RANK
10.2%
NO VEHICLES IN HOUSEHOLD
65.1/ 100
METRIC RATING
161st/ 347
METRIC RANK
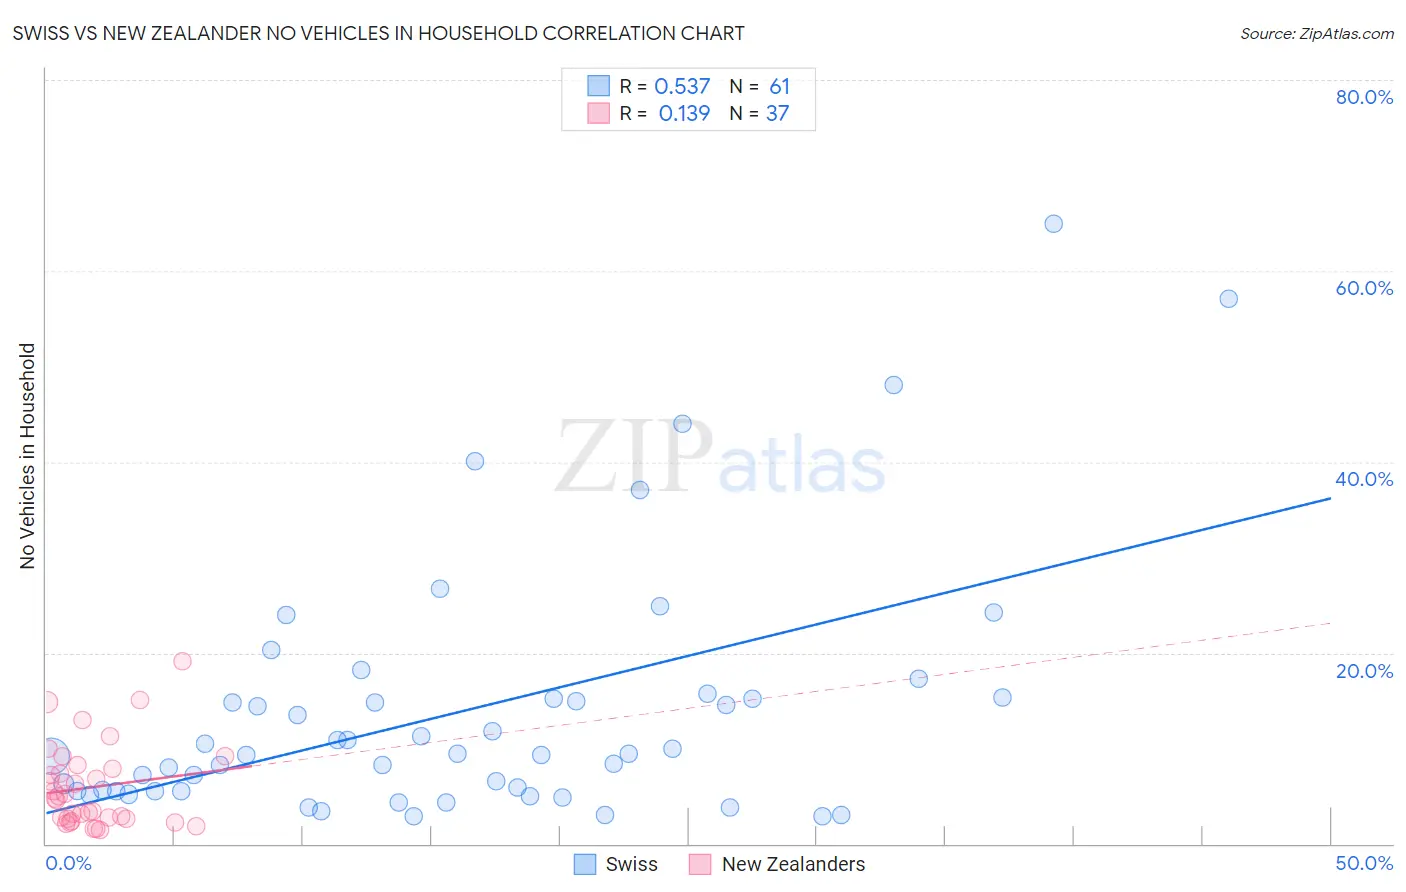
Swiss vs New Zealander No Vehicles in Household Correlation Chart
The statistical analysis conducted on geographies consisting of 462,788,069 people shows a substantial positive correlation between the proportion of Swiss and percentage of households with no vehicle available in the United States with a correlation coefficient (R) of 0.537 and weighted average of 7.9%. Similarly, the statistical analysis conducted on geographies consisting of 106,783,580 people shows a poor positive correlation between the proportion of New Zealanders and percentage of households with no vehicle available in the United States with a correlation coefficient (R) of 0.139 and weighted average of 10.2%, a difference of 29.7%.
No Vehicles in Household Correlation Summary
| Measurement | Swiss | New Zealander |
| Minimum | 2.8% | 1.5% |
| Maximum | 65.0% | 19.1% |
| Range | 62.2% | 17.7% |
| Mean | 14.0% | 5.9% |
| Median | 9.4% | 4.7% |
| Interquartile 25% (IQ1) | 5.5% | 2.6% |
| Interquartile 75% (IQ3) | 15.2% | 8.1% |
| Interquartile Range (IQR) | 9.7% | 5.4% |
| Standard Deviation (Sample) | 13.3% | 4.3% |
| Standard Deviation (Population) | 13.1% | 4.3% |
Similar Demographics by No Vehicles in Household
Demographics Similar to Swiss by No Vehicles in Household
In terms of no vehicles in household, the demographic groups most similar to Swiss are Chickasaw (7.9%, a difference of 0.080%), French Canadian (7.8%, a difference of 0.14%), Czechoslovakian (7.8%, a difference of 0.28%), Immigrants from Fiji (7.8%, a difference of 0.38%), and Choctaw (7.9%, a difference of 0.44%).
| Demographics | Rating | Rank | No Vehicles in Household |
| Cherokee | 99.9 /100 | #35 | Exceptional 7.7% |
| Iraqis | 99.9 /100 | #36 | Exceptional 7.7% |
| Basques | 99.9 /100 | #37 | Exceptional 7.8% |
| Creek | 99.9 /100 | #38 | Exceptional 7.8% |
| Immigrants | Fiji | 99.9 /100 | #39 | Exceptional 7.8% |
| Czechoslovakians | 99.9 /100 | #40 | Exceptional 7.8% |
| French Canadians | 99.9 /100 | #41 | Exceptional 7.8% |
| Swiss | 99.9 /100 | #42 | Exceptional 7.9% |
| Chickasaw | 99.9 /100 | #43 | Exceptional 7.9% |
| Choctaw | 99.9 /100 | #44 | Exceptional 7.9% |
| Immigrants | Nonimmigrants | 99.9 /100 | #45 | Exceptional 7.9% |
| Spanish | 99.9 /100 | #46 | Exceptional 7.9% |
| Northern Europeans | 99.9 /100 | #47 | Exceptional 7.9% |
| Afghans | 99.9 /100 | #48 | Exceptional 8.0% |
| Guamanians/Chamorros | 99.9 /100 | #49 | Exceptional 8.0% |
Demographics Similar to New Zealanders by No Vehicles in Household
In terms of no vehicles in household, the demographic groups most similar to New Zealanders are Immigrants from Middle Africa (10.2%, a difference of 0.10%), Immigrants from Austria (10.2%, a difference of 0.10%), Immigrants from Cambodia (10.2%, a difference of 0.21%), South African (10.2%, a difference of 0.58%), and Comanche (10.2%, a difference of 0.63%).
| Demographics | Rating | Rank | No Vehicles in Household |
| Sioux | 72.4 /100 | #154 | Good 10.1% |
| Salvadorans | 72.4 /100 | #155 | Good 10.1% |
| Immigrants | Micronesia | 70.9 /100 | #156 | Good 10.1% |
| Australians | 70.6 /100 | #157 | Good 10.1% |
| Spanish American Indians | 70.2 /100 | #158 | Good 10.1% |
| Immigrants | Indonesia | 69.3 /100 | #159 | Good 10.1% |
| Immigrants | Middle Africa | 65.7 /100 | #160 | Good 10.2% |
| New Zealanders | 65.1 /100 | #161 | Good 10.2% |
| Immigrants | Austria | 64.4 /100 | #162 | Good 10.2% |
| Immigrants | Cambodia | 63.7 /100 | #163 | Good 10.2% |
| South Africans | 61.1 /100 | #164 | Good 10.2% |
| Comanche | 60.8 /100 | #165 | Good 10.2% |
| Immigrants | Costa Rica | 60.5 /100 | #166 | Good 10.3% |
| Immigrants | Saudi Arabia | 58.8 /100 | #167 | Average 10.3% |
| Indonesians | 56.7 /100 | #168 | Average 10.3% |